Emini buy climax ignoring Trump, Russia, and healthcare
Updated 6:48 a.m.
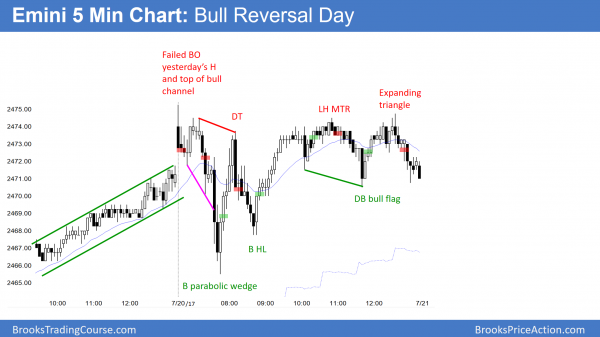
The Emini broke below yesterday’s low. This therefore triggered the sell signal on the daily chart for the parabolic wedge top. Yet, the bears only got 2 dojis on the open. Hence, they were not strong. This reduces the chances of a strong bear trend day.
However, the bulls failed to get a strong reversal up. Hence, they too are not yet strong. The bulls and bears are balanced. Furthermore, since yesterday was a trading range day, the balance has continued into today. This increases the chances of a trading range day. The Emini is now deciding on whether the 1st 2 – 3 hour swing will be up or down. Most days over the past couple of weeks took an hour or more to decide on the initial move. Today looks like it will do the same.
Pre-Open market analysis
The Emini had another bull reversal day yesterday. Yet, there is a parabolic wedge on the daily and on the monthly charts. This therefore increases the chances of 5 – 10 bars sideways to down on the daily chart over the next couple of weeks. If the bears can create that, the daily chart will have an endless pullback. It would therefore have a 40% chance of a bear break below that bull flag, and a measured move down.
Furthermore, the Emini broke above a 6 month bull channel. In general, that therefore means that there is a 75% chance of a reversal down within the next 5 days. It never looks likely because the rally is always strong, but that is the math. The odds are probably less than that here because the momentum up is strong. In addition, the bears will probably need at least a micro double top before they can create even a small reversal.
Especially relevant is that the weekly and monthly charts are in strong bull trends. Hence, the best the bears can probably achieve is a trading range for a few months on those charts.
Today is Friday so weekly support and resistance are important. The only nearby support is last week’s high. There is resistance here at the top of the 6 month bull channel.
Overnight Emini Globex trading
The Emini is unchanged in the Globex market, although it reversed down from a test of yesterday’s high over the past 3 hours. Yesterday had a bear body on the daily chart. Additionally, there is a parabolic wedge on the daily chart. Yesterday ended with a lower high major trend reversal. Day trading bears will therefore look for a reversal down today.
The bulls always want the opposite. Hence, they want today to close near its high to weaken the parabolic wedge on the daily chart.
Parabolic wedge reversals usually begin as small pullbacks in tight bear channels. Hence, they are bull flags that contain many small days. If the pullback continues for 10 or more days in a tight bear channel, then the bears begin to believe they can get a bear breakout below the bull flag. If they get their 10 bar pullback, they would have a 40% chance of a bear breakout and a swing down on the daily chart.
Because the parabolic wedge top is a buy climax, it is a sign of exhausted bulls. This increases the chances that the bulls will be less aggressive. Hence, the daily ranges will probably get smaller, and trading range days are likely over the next few days.
Yesterday’s setups
Here are several reasonable stop entry setups from yesterday. I sometimes also show limit order entries and entries on the close of bars.
EURUSD Forex market trading strategies
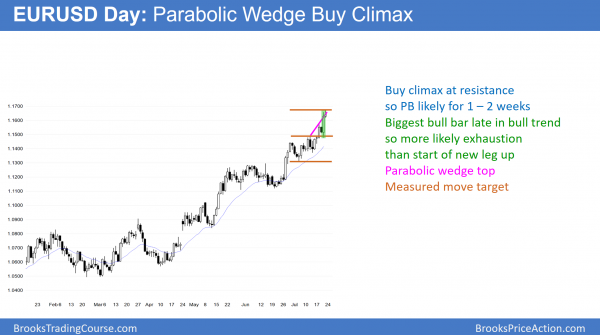
Yesterday was a big bull trend day on the daily EURUSD Forex chart. It is therefore a buy climax. In addition, it is at a measured move target. Furthermore, there is now a parabolic wedge rally. Today therefore could form a sell signal bar.
The EURUSD daily Forex chart tried to form a wedge top on Tuesday, but instead got a breakout. It was strong enough to have a 2nd leg up, which it got yesterday. While yesterday was strong enough to have another leg up, there is a problem. Yesterday was especially big. When an unusually big bar forms late in a trend, it is more likely a sign of exhaustion than the start of another leg up.
If today is another bull trend day closing near its high, then the odds will favor higher prices over the next couple of weeks. If instead today closes near its low, it means exhaustion is more likely.
While exhaustion means that the bulls take profits and stop buying, it does not mean a reversal into a bear trend. Rather, it usually means a TBTL Ten Bar, Two Leg pullback. Hence, if today closes near its low, the odds are that the daily chart will begin to pull back for a couple of weeks.
The 1st target is the bottom of the buy climax. Hence, that is about a 150 pip pullback to yesterday’s low.
Overnight EURUSD Forex trading
The EURUSD 5 minute chart had another leg up last night, but reversed down 40 pips. It has been in a tight range for 4 hours. Because of the parabolic wedge buy climax at resistance on the daily chart, bears will begin to sell for a test down to Thursday’s low. As much as the bulls want the rally to continue to the top of the 30 month range, this chart pattern is a sign that many bulls want to buy lower.
Since last night formed a Big Up, Big Down patter, the bulls and bears are balanced. If the daily chart closes here, it will favor the bears for the next 2 weeks. Yet, if the bulls rally and the day closes on its high, the bulls will probably get higher prices next week. The bears are selling for a swing trade, risking about 50 pips, to make 100 – 150 pips over the next couple of weeks.
The stop for the swing trading bulls is probably below yesterday’s low. Therefore yesterday’s low is a magnet. Many bulls will take profits if they cannot get a close near the high of the day.
Since the EURUSD market has been in a 20 pip range for 4 hours, scalpers are mostly waiting for a bigger range.
Summary of today’s S&P Emini futures price action and what to expect tomorrow
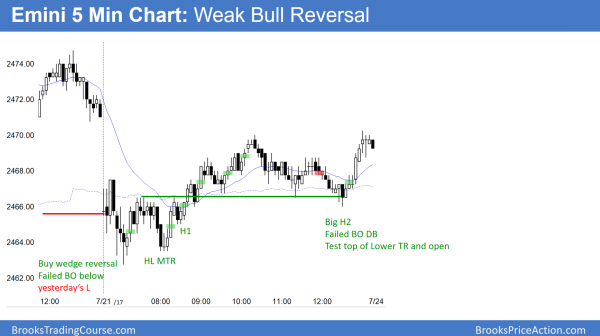
The Emini reversed up from below yesterday’s low, but the rally was weak. The day was a trading range day.
By trading below yesterday’s low, today triggered a sell signal on the daily chart where there is a parabolic wedge top. Most parabolic wedge top reversals are tight channels with small bars for several days. Most also are bull flags. Yet, about 40% have a bear breakout and lead to a swing down.
Next week is therefore important. Will the strong bull trend continue higher, or will there be a pullback? Since the weekly chart is so overbought, any rally will probably not get far.
See the weekly update for a discussion of the price action on the weekly candlestick chart and for what to expect going into next week.
Traders can see the end of the day bar-by-bar price action report by signing up for free at BrooksPriceAction.com. I talk about the detailed S&P Emini futures price action real-time throughout the day in the BrooksPriceAction.com trading room. We offer a 2 day free trial.
When I mention time, it is USA Pacific Standard Time (the Emini day session opens at 6:30 am PST, and closes at 1:15 pm PST). You can read background information on the intraday market reports on the Intraday Market Update page.


Hi Al,
What are your thoughts on these trades in today’s emini PA?
1) I shorted at bar #17 close since it was turning down from the 60 min moving average – scalped it out for a point though since it was shorting low in the bull channel
2) I didn’t short below 64, I shorted at the 66 low – I waited for a bull bar to short below since 64 was on the 5 min EMA – got out with a point though, I didn’t trust the leg down – at what point should traders have gotten out, on the 71 bull reversal bar?
3) I bought right where you placed your last long of the day on 74 but got out with .25 points because I didn’t like the doji and since it was nearing the end of the day, in retrospect wouldn’t a better trade have been a buy stop above the #75 doji, also a tick above the 68 bear bar?