Emini buy climax awaiting catalyst for 100 point correction
Updated 6:45 a.m.
The Emini opened with a big gap above yesterday’s close and 2500, and a small gap above yesterday’s high. Since the 1st 2 bars were bull bars, the Emini is Always In Long. This reduces the chances of a bear trend day. Because the Emini has been in a trading range for 10 days, the odds are against a strong bull trend day.
When there is a gap up, the Emini early on decides between a trend from the open up or down, and a trading range. The consecutive bull bars make a bear trend less likely. Yet, the bull bars are not big and the All Time high just above is resistance. Furthermore, the Emini has been in a tight range for 10 days. Therefore, if today is a bull trend day, it will probably not be a big bull day.
Most likely, the Emini will have a trading range open. After that, it will decide on the direction of the 1st swing. The odds favor a sideways to up day, unless the bears can create some big bear bars. The pullback on the 3rd bar and the 3 small initial bars reduce the chance of a big trend day.
Pre-Open market analysis
The Emini tested below last week’s low again yesterday, and it again reversed up. Yet, the rally was not strong. In addition, it was just another trading range day in the 10 day trading range. However, Monday’s reversal up was strong enough so that the bulls might get 1 more new high over the next week. However, since the monthly chart is so extremely climactic, the odds of much higher prices without a 1 – 3 month pullback are small.
Overnight Emini Globex trading
The Emini is up 5 points in the Globex market. The bulls want the 2 day reversal to lead to a strong breakout above the all-time high. While they might get a new high, it will probably fail. This is because the monthly chart is so overextended and because most trading range breakouts fail. More likely, the Emini will continue sideways rather than break strongly to a new high. Furthermore, because the monthly chart is so extreme, the odds favor a 100 point reversal over the next couple of months. This increases the chance of a big bear day or consecutive big bear days at any time soon.
While the reversal up from the small dip below the August 8 high was sharp, the follow-through yesterday was weak. This increases the chances that the 10 day trading range will continue. As a result, the odds are against a strong trend day up or down. Most days over the past 2 weeks have had at least one leg up and one leg down. Therefore, this is likely again today. The odds favor more trading range trading.
Yesterday’s setups
Here are several reasonable stop entry setups from yesterday. I sometimes also show limit order entries and entries on the close of bars.
EURUSD Forex market trading strategies
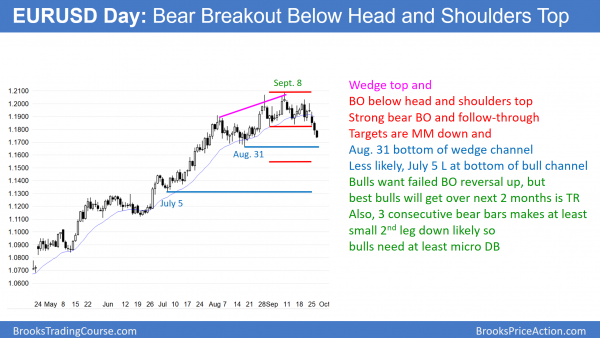
The daily chart had a strong breakout below the neck line of a head and shoulders top. Furthermore, yesterday was a strong follow-through bear bar. This makes a test of the August 17 major higher low likely. So far, today is a 3rd consecutive bear day. The odds are that the bears will get at least a small 2nd leg down from this 3 day bear breakout. The bulls will probably need at least a micro double bottom before they can reverse the selloff.
The bears broke below the 3 week trading range. The selloff is now trying to test the next support, which is the August 17 major higher low. That is also the beginning of the wedge bull channel, and therefore an additional magnet. When a bear breakout has 2 or more big bear bars closing near their lows or below their midpoints, the odds favor at least a small 2nd leg down. Consequently, if the bulls get a 1 – 3 day reversal over the next week, it will probably be a pullback from this breakout. Hence, traders will sell it. Therefore the bulls will probably need at least a micro double bottom before they can create a bottom. In addition, the bull trend has now evolved into a trading range. Therefore, even if the bulls get a 5 day rally, it will probably be a bear leg in that trading range. Hence, it will probably be followed by another bear leg.
Where is the bottom
The daily chart is probing for a bottom to the range. Since the August 27 higher low is major and a test of the breakout above the 2 year trading range, many bears will take partial profits there. In addition, bull scalpers will begin buying around that low. As a result, the selloff on the daily chart will probably stall and possibly bounce between 1.1600 and 1.1700. If so, that would create a double bottom with the August 17 low. It would therefore be a reasonable bottom to the range. The range would probably last at least several weeks more.
If the daily chart breaks strongly below that low over the next several weeks, the next major support would be a measured move down from the 400 pip tall trading range. That would therefore test the July 5 low, which was the start of the tight bull channel after the strong June breakout. More likely, the daily chart will find support between 1.1400 and 1.1600 because that is the top of the 2015 – 2016 trading range. The breakout above that range was very strong. It is therefore likely that this selloff is simply a pullback to test the breakout on the weekly chart.
Overnight EURUSD Forex trading
The 5 minute chart has been in a 25 pip range for the past 6 hours. While it is now breaking below that range, the selloff on the 60 minute chart has been in a series of sell climaxes. In addition, the selloff is getting near the August lows on the 240 minute chart around 1.1700. The chart reversed up many times there in August. It is therefore major support. The odds are that the bulls will get a 100 pip rally that starts in the next few days. Hence, the bears will probably take partial profits around the current price, and bulls will begin to buy for a bounce. Less likely, the selloff will continue far below this support without a 100 pip bounce first.
Summary of today’s S&P Emini futures price action and what to expect tomorrow
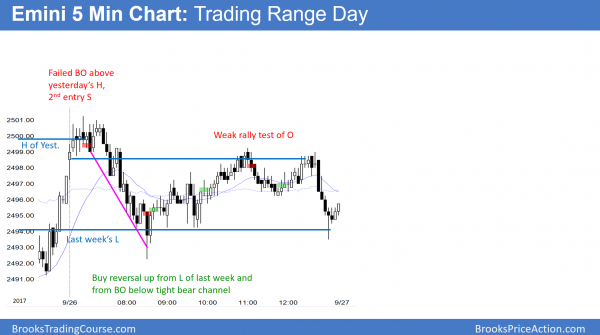
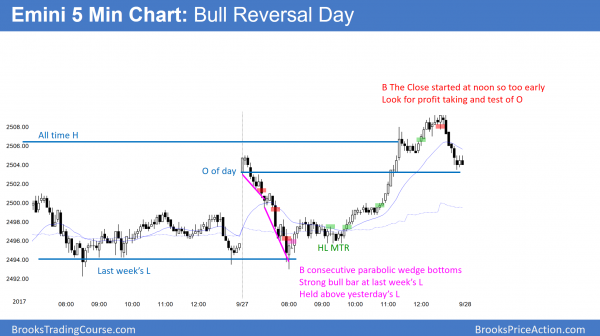
The Emini sold off strongly, but reversed up from consecutive bottoms at last week’s low. It then reversed up strongly to a new all-time high. Since it closed near the open, it formed another doji day.
The Emini strongly reversed up from below last week’s low to above last week’s high and therefore a new all-time high. This week is therefore an outside up week. Because the monthly chart is so climactic, the odds are against much higher prices without a 1 – 3 months pullback first. Because today’s rally was climactic, the odds favor at least a 2 hour trading range tomorrow that starts by the end of the 2nd hour.
See the weekly update for a discussion of the price action on the weekly candlestick chart and for what to expect going into next week.
Traders can see the end of the day bar-by-bar price action report by signing up for free at BrooksPriceAction.com. I talk about the detailed S&P Emini futures price action real-time throughout the day in the BrooksPriceAction.com trading room. We offer a 2 day free trial.
When I mention time, it is USA Pacific Standard Time (the Emini day session opens at 6:30 am PST, and closes at 1:15 pm PST). You can read background information on the intraday market reports on the Intraday Market Update page.


Hi Al,
What would be an appropriate catalyst? Could it be minor since emini is overbought and perhaps waiting for any opportunity to correct? Or does it still have to be a major piece of news?
Catalysts are often minor, and are not really catalysts at all. It just takes some pundit on TV to announce, “Today’s selloff was caused by news about…” Unless there is a clear strong catalyst, like bombing North Korea, most “catalysts” are not catalysts. They are simply coincidences that have nothing to do with the breakout. However, the TV experts would have you believe otherwise. Human nature has us always looking for an explanation to relieve our anxiety over the unknown. People need to believe something just to feel in control. Consequently, once a consensus forms about what the catalyst is, the news runs with it. Yet, it is usually nonsense.
Most big selloffs have no clear reason, even in hindsight. There are countless factors involved, and many have to do with algorithms. Most institutional trading is done by computers. If enough start selling for any reason, the selling will cause others to sell. This can cascade and lead to a huge selloff. It can be brief, like the 2010 flash crash, or it can last for months.
All moves are simply tests of support or resistance in the market’s constant search for the fairest price. The 1987 crash ended at the monthly trend line. It was simply a very fast and big test of support.
Thanks Al, I just want to say I really appreciate your course and all the information you provide, it has changed my life.
Al,
Not sure where to communicate this to you, but regarding your trade station issue today, if you enter in a “trading strategy” including an “exit strategy” such as an LX or SX, on one of your chart analysis charts, you will see the correct way tradestation reflects your trades on the chart. For example it will show “buy 1” on your entry and “PTLX 0” on your exit. The “PTLX” means it exited the long entry at Profit Target.
If Tradestation can do it for their standard auto strategies, surely you can program it for you to enter and exit manual entries.
Hope this helps.
Bob
Hi, Bob,
I agree with you that TS has behaved that way in earlier release, and it might behave that way for automated strategy trading. The current version 21 has it backwards for manual order entries.
As you saw, TS showed a -1 over the sell bar and a 0 below the buy bar. However, since the buy came 1st, it should have been a 1 below the B bar and a 0 over the S bar. Yet, by TS putting the -1 over the sell bar, they got it backwards. It indicates that I sold to enter, and then bought to exit 3 bars earlier!!
I spoke with 4 TS tech people today. When I got to the top of the food chain, he agreed that it is a bug. He said that they will try to get it fixed in the next release.
Thanks,
Al