Trading Update: Wednesday June 8, 2022
Emini pre-open market analysis
Emini daily chart
- Yesterday was a strong bull close that reversed up from near the lows of the 6-bar tight trading range. This might be the start of a second leg up from the May 27 bull breakout. Emini bulls want 2nd leg up.
- The bulls are doing a good job keeping the measuring gap from the May 17 high to the June 2 low open. A measured move from the May 20 low to the May 17 high projects to above the April 18 low.
- The bulls also have a measured move from the May 25 open to the May 27 close, which projects up to the April 18 low.
- At the moment, the odds are the Emini will get back up to the April 18 low.
- The three-bar bull rally that ended on May 27 was likely strong enough to make the market always in long.
- The bears have been hopeful that the May 27 rally would lead to a 2nd leg trap, and the market would test back down to the May 25 low. The bears have had many chances for the 2nd leg trap. However, the bulls are getting too many big bull trend bars closing near their highs.
- Overall, the bulls may soon get a bull breakout of the June high. While the bears may create a final flag reversal if the market breaks above the June high.
- Right now, the odds favor the upside breakout. If the bulls get an upside breakout that quickly fails, the bears will have a reasonable wedge top, and the market may have to go lower.
Emini 5-minute chart and what to expect today
- Emini is down 18 points in the overnight Globex session.
- The bulls have a reasonable chance of getting a close above the open today.
- Traders should look for potential opening reversals that lead to buy setups such as a double bottom or wedge bottom. The market may have a trend from the open bull trend.
- With all the buying pressure on the daily chart, traders are beginning to wonder if the market will have to see if there are more buyers than sellers above the June 2 high.
- Just because the bulls have a reasonable chance of an opening reversal, traders cannot be in denial if the market gaps down or forms a bear trend from the open.
- As always, traders must trade the chart in front of them and not what they hope will happen.
- With the market gapping down, traders should expect a test of the moving average (similar to yesterday). Next, the market will decide on trend resumption down or trend reversal up.
- If a trader has trouble on the open, they should consider waiting for 6-12 bars. The open usually has lots of reversals up and down, so it is essential to be cautious on the open and understand most opens are limit order markets.
- Traders can also wait for a credible stop entry such as a double bottom, top, or a wedge bottom/top. Lastly, they can wait for a strong breakout like we had yesterday around 7:30 PT.
Yesterday’s Emini setups

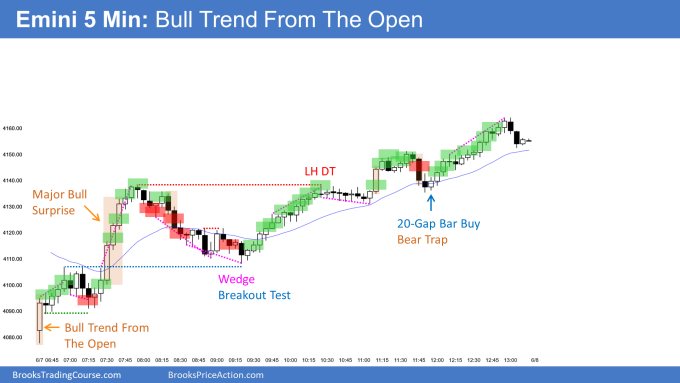
Al created the SP500 Emini charts.
Here are several reasonable stop entry setups from yesterday. I show each buy entry with a green rectangle and each sell entry with a red rectangle. Buyers of both the Brooks Trading Course and Encyclopedia of Chart Patterns have access to a much more detailed explanation of the swing trades for each day (see Online Course/BTC Daily Setups).
My goal with these charts is to present an Always In perspective. If a trader was trying to be Always In or nearly Always In a position all day, and he was not currently in the market, these entries would be logical times for him to enter. These therefore are swing entries.
It is important to understand that most swing setups do not lead to swing trades. As soon as traders are disappointed, many exit. Those who exit prefer to get out with a small profit (scalp), but often have to exit with a small loss.
If the risk is too big for your account, you should wait for trades with less risk or trade an alternative market like the Micro Emini.
EURUSD Forex market trading strategies
EURUSD Forex daily chart

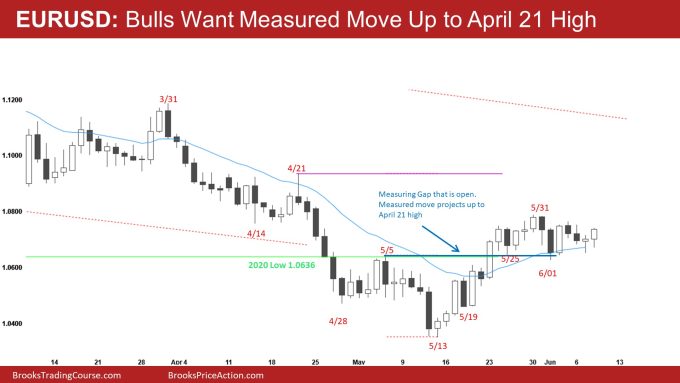
- The bulls triggered yesterday’s buy signal bar, and so far, today is a decent entry bar for the bulls.
- Bulls hope that today is the start of trend resumption up and that the market will break above the May 31 high and reach the April 21 high.
- The bears hope that any breakout above the tight trading range that began on May 24 will lead to a final flag reversal and test back down.
- If the market goes above May 31 soon, the market may try to form a wedge top (May 5 and May 31). If the bears do get the wedge top, they would see it as a double top with the April 21 high.
- The bears want to prevent the market from getting above the April 21 high because it is a major lower high. As long as the market is below the April 21 high, the bears can argue that the market is still in a bear trend.
- One problem the bears have with the wedge top argument is that the bears were unable to close the gap from the May 5 high to the May 25 low. The bears should have gotten a close below the May 5 high to demonstrate strength but failed.
- A measured move from May 13 low to the May 5 high (measuring gap) projects up to the April 21 high, increasing the odds that the market will have to reach it.
- Overall, the bears, will try hard to prevent the bulls from getting a strong entry bar today, and the bulls want to create a big bull trend bar. If the bulls can get a decent entry bar today, they will try for another bull trend bar tomorrow.
Summary of today’s S&P Emini futures price action and what to expect tomorrow

Al created the SP500 Emini charts.
End of day summary
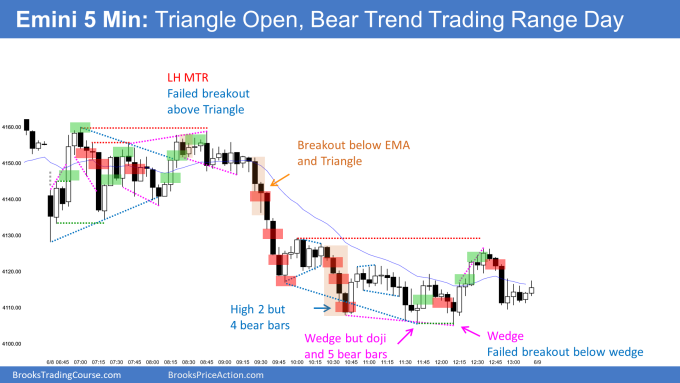
- Today was a triangle open that was a bear trending trading range day.
- The market went sideways in a contacting range for the first 18 bars.
- The bulls tried to break out above the triangle (8:15 PT) but failed as the bears got a strong bear breakout below the moving average and the midpoint of the triangle.
- The bear breakout had six consecutive bear bars down to 9:30, which made the odds favor at least a couple of legs down.
- The market formed a wedge bottom around 11:40 that led to two legs sideways to up.
- Although the bulls never reached the bottom of the first 3-hour trading range (bars 1 – 36), the day was still a trending trading range day.
- As strong as the bears were, there were limit order bulls who bought the lows of the bar 1 – 36 range and scaled in the lower betting worse, in case they could avoid a loss.
- Another thing to point out is the bulls formed a lot of buying pressure after the six consecutive bear bar selloff down to 9:45. The bull bars up to 10:00, the 10:10 bull bar, and the 10:20 bull bar increased the odds of trading range price action soon.
- Today was an inside bar closing near its low.
- The daily chart is beginning to accumulate selling pressure, and if the bulls do not get their upside breakout soon, the bears may get their bear breakout that could test the May 25 (2nd leg trap).
See the weekly update for a discussion of the price action on the weekly chart and for what to expect going into next week.
Trading Room
Traders can see the end of the day bar-by-bar price action report by signing up for free at BrooksPriceAction.com. Al talks about the detailed S&P Emini futures price action real-time throughout the day in the BrooksPriceAction.com on trading room days. We offer a 2 day free trial.
Charts use Pacific Time
When times are mentioned, it is USA Pacific Time. The Emini day session charts begin at 6:30 am PT and end at 1:15 pm PT which is 15 minutes after the NYSE closes. You can read background information on the market reports on the Market Update page.


Hi, Brad! Tks for your analyze. Below are some notes that I made a little different from you.
– I dont sell below bar 6 because 4 and 5 was two strong bull trend bar so i prefer wait second signal that never came..
– For the same reason I dont buy 10, even though was double bottom witk 4 or 2, in that point (for me) the market was BUBD, and a buy in that point was in the midle the TR, and i prefer second entry after four consecutives bear bars.
– I dont buy 13 because its high in TR and after 14 i assume TTR.
– I thought buy 20, but with wide stop the reward was far away from the high of the day, so i dont take that buy BUT i paid attention from the little channel that formed (spike and channel (spike from 6 – 8; and channel 12 – 20) and your breakout was a measuring move, that was hit in 22 (closed exactly in MM)
– 21 i dont sell because three big bull bars, so i expect a least small second leg, and the 24 was ii (maybe ff) so i want so much sell and that point, but the market dont make a bear bar, so i wait;
– 27 i sell a close. maybe I was a little hasty. my stop was a MM from 20 – 22. After i Sell below 31 and rase to stop from high 6 (as I short my stop I decided to add the remainder to leave the operation with my normal Risk.)
– I realize full profits in 2×1 my initial risk, that be a little below from MM that buy climax (20-22).
Again, tnks for you analyses day by day, is very helpful for me!
OBS: sorry if some words dont make sense, i am not so fluent in English..
Att, Filipe Henrique Ciervo
For those who want a more detailed discussion of the day, I highly recommend Al’s Trading room (see link below). The trading room webinar is recorded (it is life in real-time, though) and usually over two hours of the audio time of Al discussing his thoughts on the day and how he reads the market in real-time. Also, he gives an end-of-the-day breakdown bar by bar of what is happening. While it is essential to study the video course, it is also necessary to learn how to apply for the course and analyze the market in real-time. This means one must learn how to interpret the market properly and truly know how not to be emotional during the trading day. Listening to Al speak (in real-time) calmly about both arguments and seeing how he is constantly analyzing both the bulls and the bears is crucial to understand. Below is a link to sign up for the daily webinar. Also, there is a two-day free trial of the webinar.
If anyone has questions about the trading room, I am happy to discuss more.
https://www.brookspriceaction.com/viewtopic.php?t=5989
Near the top of the second range was a 50% PB from yesterday’s total trend. That and the PB support zone made me rethink a MTR. I took the last bull entry on the chart and tidily exited beneath the bear inside bar, before cringing through the bear BO bar.