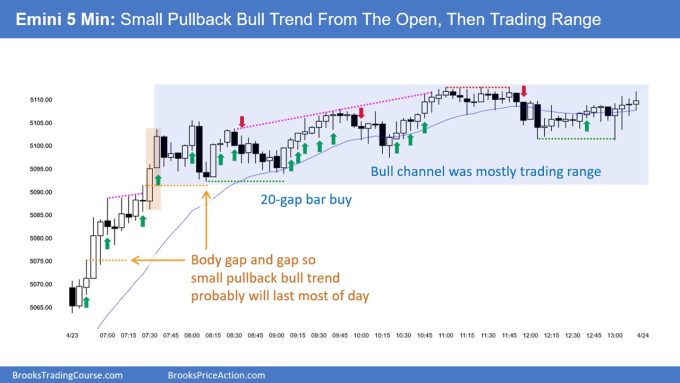
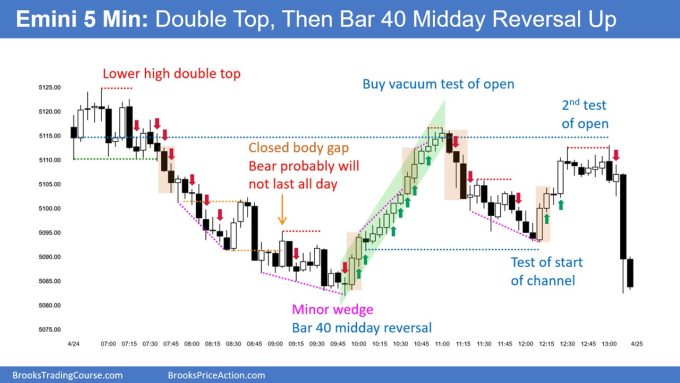
Trading Update: Wednesday April 24, 2024
S&P Emini pre-open market analysis
Emini daily chart
- The Emini rallied yesterday, forming a bull trend bar that closed on its high. The bulls are trapping the bears who sold the midpoint of the bull channel that began in January.
- The bulls hope the reversal of the 5,000 round number will continue today and trap the bears selling near support.
- More likely, the market is in a trading range, and the bulls will be disappointed today or tomorrow.
- Bears were not interested in buying near the 5,000-support level due to the market forming a trading range. Most bears were interested in buying higher, especially if the bulls formed a weak rally that lasted a few legs near the moving average.
- The bears who sold the high of April 19th sold too low in a trading range and are likely disappointed with the past two trading days. This increases the probability that the bears will be happy to buy back shorts on any pullback.
- The bulls are hopeful they can trap the bears further and get a strong upside breakout.
- If the bulls get a strong breakout, that will trap the bears hopeful for a second leg down, increasing the risk of a breakout above the March high.
- More likely, any rally the bulls get will be a bull leg in a trading range and eventually test down to the April 19th low.
- Overall, the bears are interested in selling but will likely wait to see what kind of brief second leg the bulls will get. This gives the bull an opportunity to add bull bars to the rally, which would further disappoint the bears. Traders expect an attempt at a Low 1 setup to develop over the next day or two.
Emini 5-minute chart and what to expect today
- The Globex market sold off during the overnight hours, testing near the bottom of yesterday’s bull channel (15–minute chart).
- Bull channels should be thought of as bear flags that get downside breakouts, evolving into a trading range.
- The overnight selloff formed a tight bear channel, and the bulls recently formed a trendline break of the bear channel early this morning around 8:30 AM EST.
- The market is currently new to the lows of the overnight session and deciding on a double bottom or a downside breakout below the 6:00 AM EST low.
- The open of the U.S. Session will likely have little to no gap.
- Traders should expect the tight trading range going into yesterday’s close to impact the market, increasing the odds or more sideways trading.
- There is an 80% chance of a trading range open and only a 20% chance of a trend from the open.
- Most traders should be patient on the open and consider waiting for 6 – 12 bars before placing a trade. This is because trading is more likely than a bull trend. All trading ranges have a variation of a double top/bottom or a wedge top/bottom. This means that there is at least an 80% chance of one of the patterns mentioned above forming, and a trader can wait for one to appear before placing a trade.
Yesterday’s Emini setups

Al created the SP500 Emini charts.
Here are reasonable stop entry setups from yesterday. I show each buy entry bar with a green arrow and each sell entry bar with a red arrow. Buyers of both the Brooks Trading Course and Encyclopedia of Chart Patterns have access to a near 4-year library of more detailed explanations of swing trade setups (see Online Course/BTC Daily Setups). Encyclopedia members get current daily charts added to Encyclopedia.
My goal with these charts is to present an Always In perspective. If a trader was trying to be Always In or nearly Always In a position all day, and he was not currently in the market, these entries would be logical times for him to enter. These therefore are swing entries.
It is important to understand that most swing setups do not lead to swing trades. As soon as traders are disappointed, many exit. Those who exit prefer to get out with a small profit (scalp), but often have to exit with a small loss.
If the risk is too big for your account, you should wait for trades with less risk or trade an alternative market like the Micro Emini.
EURUSD Forex market trading strategies
EURUSD Forex daily chart
- The EURUSD formed an upside breakout yesterday, following Monday’s inside bar.
- The market is deciding between a second leg bear trap, with April 2nd beginning Leg 1 and April 16th as Leg 2.
- The bulls did a good job yesterday, getting an upside breakout bar. However, it overlaps most of the tight trading range. The breakout bar also lacks follow-through. Both of these reasons lower the probability of the bulls.
- The bulls need to do more to convince the bulls that the market is becoming Always In Long.
- Traders are paying close attention to the April 2nd breakout point low. It was reasonable to buy the low betting on a trading range. This means that the odds favor price going above the April 2nd breakout point low.
- It would be better for the bulls to get a strong close above the April 2nd low. This would eliminate the possibility of April 2nd forming a negative gap.
- The bears want to create a strong reversal bar today, forming a Low 2 and trapping bulls who bought yesterday’s upside breakout.
- More likely, today will disappoint both the bulls and bears, adding confusion to the market.
Summary of today’s S&P Emini price action

Al created the SP500 Emini charts.
See the weekly update for a discussion of the price action on the weekly chart and for what to expect going into next week.
Trading Room
Al Brooks and other presenters talk about the detailed Emini price action real-time each day in the BrooksPriceAction.com trading room days. We offer a 2 day free trial.
Charts use Pacific Time
When times are mentioned, it is USA Pacific Time. The Emini day session charts begin at 6:30 am PT and end at 1:15 pm PT which is 15 minutes after the NYSE closes. You can read background information on the market reports on the Market Update page.


me eating my words. glad I didn’t stick around and have the Bears eat up profit…
Myself I was victim of bulltrap, buying above B25; it seemed to me bulls had done enough to reverse. I see Al has marked “Closed body gap” in orange with orange lines at B25 close and B24 low. This seems important to always-in approach, and I can’t figure out which body(s) he’s referring to, so can’t figure out how it closed. Can someone explain how those lines describe a body gap, and how to determine that it closed?
#41 i see the channel 31-41 and thought it might continue more, even #42 broke out of channel, i was still seeing #43 bad follow through might bring it back into the channel. And it took off higher to OOD. I was looking for DT with #26 since #27 is strong which did not happen. Looking back #40 is possible wedge (28,33, 37) but bad SB, #42 broke the channel so it is possible decent entry but it might come back in even the bear trend. Where would you exit short if still short at #41?
Good Call Brad, Bears didn’t even get to midpoint of channel.