Trading Update: Friday August 26, 2022
Emini pre-open market analysis
Emini daily chart
- The bulls got a strong rally into the close yesterday, which caused yesterday to close on its high. Bulls strong follow-through bar wanted today to increase the odds of testing the August high.
- This is good for the bulls and increases the odds that the market will go a little higher and reach the midpoint of the year (4,220 area).
- It is possible the market will retest the August high during this rally if the bulls can get follow-through today or tomorrow. It would be ideal if the bulls could get another strong bull close today, similar to yesterday. That would trap bears who sold a pullback of the selloff down to August 24, which would cause some of those bears to panic out of shorts and drive the market up to the April 18 low.
- More likely, today will disappoint the bulls and add more confusion to the daily chart.
- The market is so close to the April 18 low and the top of the bull trendline (January high and March 29 high) that it may have to reach it. The market could continue sideways here, eventually reaching the top of the trendline (4,328), which would satisfy a test of it.
- The bears see the selloff down to August 24 as a trendline break of the August rally. They want any test of the August high to lead to a double top major trend reversal. Next, those bears would want a breakout below the August 24 low and measured move down to around the 3,900 area.
- Overall, the market is in an extensive trading range, so traders should expect disappointment for both sides and confusion.
- Traders will pay attention to today and see if the bulls can get follow-through today, or if they will be disappointed with today as expected, since the market is in a trading range.
- Today is Friday, so weekly support and resistance are important. The bulls have done an excellent job getting the market to close on its high. The market is getting close to last week’s low (4,227.25), which will act as some resistance as some bulls take profits there. The market may reach the previous week’s low before the end of the week.
- The open of the week is another magnet (4,178.25) as the bears will try and drive the market back down or as close to the open as they can.
Emini 5-minute chart and what to expect today
- Emini is up 17 points in the overnight Globex session.
- The Globex market has been sideways for most of the overnight session, and it looks like the open it will have a gap up.
- Traders should expect a trading range open with lots of limit order trading.
- Most traders should wait for 6-12 bars before placing a trade since most breakouts will fail on the open.
- Traders can also consider waiting for a credible stop entry such as a double top/bottom or wedge top/bottom.
- Lastly, traders can also wait for a credible stop entry with follow-through breaking above/below the range.
- The most important thing on the open is to be patient. Eventually, a credible swing trade will happen, but it is important not to be too eager on the open. It is easy to take one or two bad trades on the open; if the bars are big, one could lose more than they expect to make back before the end of the day.
- The key to consistency is to focus on getting rid of the “dumb” trades, as Al often says. What he means is to focus on stop taking the trades with poor math. Everyone has enough willing trades to become consistent. However, the other trades with poor math usually erode one’s profit over time.
- Lastly, since today is Friday, there is an increased risk of a strong breakout up or down late in the day as institutions decide the close of the weekly chart, so traders should be open to anything going into the final hour or two of the week.
Yesterday’s Emini setups

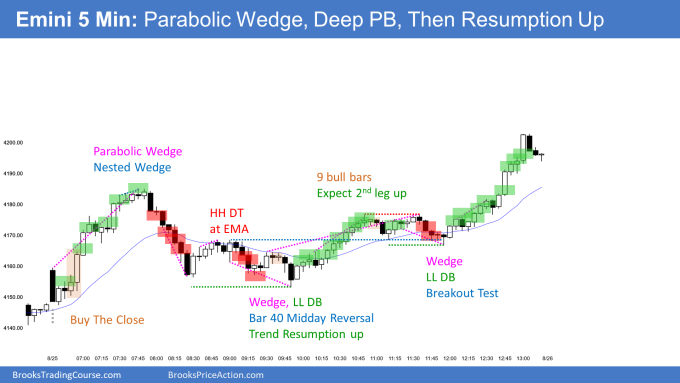
Al created the SP500 Emini charts.
Here are several reasonable stop entry setups from yesterday. I show each buy entry with a green rectangle and each sell entry with a red rectangle. Buyers of both the Brooks Trading Course and Encyclopedia of Chart Patterns have access to a much more detailed explanation of the swing trades for each day (see Online Course/BTC Daily Setups).
My goal with these charts is to present an Always In perspective. If a trader was trying to be Always In or nearly Always In a position all day, and he was not currently in the market, these entries would be logical times for him to enter. These therefore are swing entries.
It is important to understand that most swing setups do not lead to swing trades. As soon as traders are disappointed, many exit. Those who exit prefer to get out with a small profit (scalp), but often have to exit with a small loss.
If the risk is too big for your account, you should wait for trades with less risk or trade an alternative market like the Micro Emini.
EURUSD Forex market trading strategies
EURUSD Forex daily chart

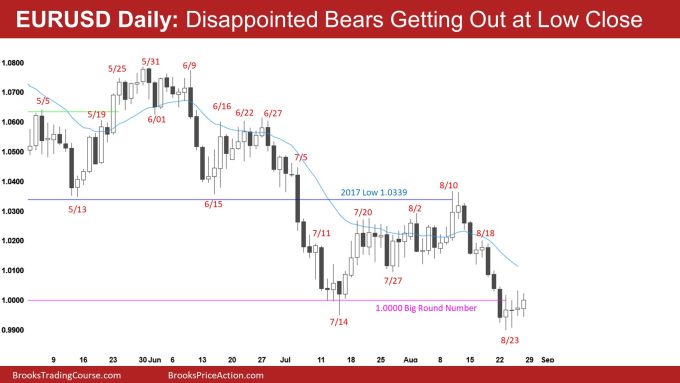
- The bears have been disappointed with the past three weak follow-through bars after August 23. Some are buying back shorts around the low close (August 23), which is why the market is bouncing here.
- The market formed a Low 1 short yesterday. However, it is a bull doji bar and follows two other bull doji bars. This increases the odds of trading range price action and lowers the probability of selling below yesterday’s bar. Another reason why traders bought at or below yesterday’s low.
- The bulls are starting to do a good job of causing the market to stall around the 1.000 big round number.
- Next, the bulls need to get a strong bull bar closing on its high and preferably closing above the highs of the past four bars.
- The selloff down to August 23 is in a tight channel, which increases the odds that the first reversal down will fail, so the market still may have to go more sideways at this price level.
- The bears see the past four bars as a pullback and a minor reversal, and they are probably right. However, the market has been in a trading range since mid-July. This means that the although the odds favor a minor reversal up, the pullback could be much deeper than the bears want.
- Also, the bulls have a reasonable chance at getting a double bottom with the July 14 low here.
- Ultimately, the market will likely return to the mid-May-June trading range over the next few months.
- The next target for the bulls would be a breakout above the August 10 neckline of the double bottom (July 14 and August 23). The bulls want a measured move up to around the May high.
- Today is Friday, so a weekly chart is essential. The current bar on the weekly chart is a reversal bar, within 40 pips of the open of the week. The bulls will try their best to close above the open of the week and far above it, creating a bull reversal bar on the week.
- The bears want the opposite, and the market to close around the week’s midpoint. The bulls have already done the damage, and the bears will likely have difficulty driving the market down to the middle of this week’s range.
Summary of today’s S&P Emini futures price action and what to expect tomorrow

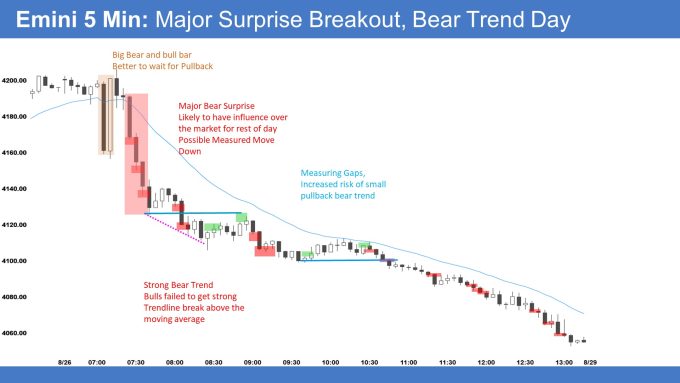
Brad created the SP500 Emini chart.
End of day video review
End of day review
- Very big bear trend day for the bears.
- When you get a bar like bar 7 that is 40 points tall, it is almost always better to wait and buy a pullback.
- When you get a bar several times larger than the average bar size, the odds are high that one can wait and enter on a pullback. One of the reasons for this is that the math is bad to enter in the direction of a bar like 7 or 8.
- If one sells the close of bar 7 and puts a stop at the top of the bar, it is unlikely they will make a measured move down of their initial risk (40%).
- In this case, the market did go much lower however that was a lower probability event. Bears should have gotten trapped after the bar 8 bull close; there were likely buyers at the close of bar 7 during bars 11 and 12.
- Bar 11 and 12 were strong and trapped bears out and bulls in. This is because traders were anticipating buyers below after bar 8. Bears disappointed after bar 7, looking to exit with a smaller loss, and bulls buying a pullback of 8. The strength of bars 11 and 12 trapped bulls out and bears in the market.
- The strength of the selloff down to bar 14 trapped bulls betting on buyers below bar 8, and the market went down for a measured move.
- The market formed gaps on the day down (blue lines in the above chart), increasing the odds of lower prices.
- Also, after the selloff down to 14, the bulls could not get consecutive strong bull closes on any of the pullbacks and could not get a strong close above the moving average. This increased the odds of a trading range and minor reversal at best for the bulls.
- Overall, surprise day and climactic behavior. There will be a 75% chance of at least two hours sideways starting before the end of the second hour on Monday. There is a 50% chance of follow-through selling on the open, but even if there is follow-through, it will likely form a trading range for several hours.
- Today was a surprise bar on the daily chart, increasing the odds of a second leg down. However, today was climactic, so the daily chart may have to go sideways on Monday before a 2nd leg down.
See the weekly update for a discussion of the price action on the weekly chart and for what to expect going into next week.
Trading Room
Traders can see the end of the day bar-by-bar price action report by signing up for free at BrooksPriceAction.com. Al talks about the detailed S&P Emini futures price action real-time throughout the day in the BrooksPriceAction.com on trading room days. We offer a 2 day free trial.
Charts use Pacific Time
When times are mentioned, it is USA Pacific Time. The Emini day session charts begin at 6:30 am PT and end at 1:15 pm PT which is 15 minutes after the NYSE closes. You can read background information on the market reports on the Market Update page.


Thanks Brad for your market comments and end of day video. I look forward to them each day.
Can you please explain why it is not a good buy above the 5th and 8th bar, and not a good sell below the 7th bar?
The 5th bar was a wedge bottom, but the channel down was tight, so probably a minor reversal up. If a trader took the buy, they would likely be quick to exit below the follow-through bar when it closed below its midpoint.
The problem with bar 7 selling is that it is 40 points and not sustainable. If you risk 40 points, you will probably not make 40 points. This means that bears would want to sell a pullback, which means there might be more buyers on the bar 7 close.
The problem with bar 8 is that it is also a big bar, so the risk is enormous. It is forcing trading to buy at the top of a trading range, and the odds might still favor a second leg down after the bar 7 bear bar. This means there are probably more sellers above bar 8 betting on a second leg down. Also, bulls know they can probably buy a pullback, so the risk of missing a big move up on bar 9 is small.
Overall, 5 was an okay swing buy but not great (tight bear channel). Bar 7 and 8, the risk is significant. Considerable risk creates a bad risk reward. When a trader has a bad risk-reward trade, they need a high probability, or the math does not work. So even if a bear sells bar 7 and risks only 20 points, they have to ask themself what the probability of risking 20 points is to make, say, 20 points. They cannot take the trade if the probability is less than 60%. Also, when you get a big breakout bar, it is usually better to wait and see the follow-through.
I hope this helps.
Thanks Brad. Your explanation for bar 5 is reasonable, about bar 7 and 8 however…
I don’t remember Al mentioning anything like that in his course. Quite the contrary, he always says: “The bigger a BO bar, the higher the probability, the bigger the risk. So, unless you cannot risk that much, don’t take the trade”. Nothing like “don’t take the trade if the BO bar is more than x number of ticks tall”.
Only two conditions when a big BO bar is a bad buy/sell: 1. 2nd leg trap and 2. exhaustion gap.
Sure, I agree with the logic that the bigger the bar, the bigger the risk and thus the higher the probability. But at some point, the risk becomes so big that if you take that trade, it will result in a losing strategy over time.
Take bar 7 for a moment. The average daily range of the past 50 trading days (not including Today (8/26) was 60 points. This means that bar 7 covered 66% of the average daily range in one 5-minute bar, a rare event. Out of those 50 days, there were only nine trading days that had a capacity greater than 80 points which is double the range of bar 7. I am making a point that an 80-point range day has been rare, especially when there is a 40-point bar.
Refer to video 29C slide 2; it might help. Also, I get that 50 days is a small sample size, but I just wanted to make the point that when a bar gets too big, it becomes climactic and increases the odds of a pullback or reversal. Bears would want to wait to sell until the close of bar 7.