Trading Update: Wednesday May 1, 2024
S&P Emini pre-open market analysis
Emini daily chart
- The Emini sold off yesterday after getting two legs up to the moving average. The Bulls tried to get the upside breakout. However, they failed and gave up once the momentum stalled at the moving average.
- While the Bulls did a good job getting a bounce up from the 5,000-round number, the selloff down to the April low was strong enough for a second leg down.
- Yesterday was a strong enough breakout that the first reversal will probably fail.
- The bears are hopeful that today will create a strong follow-through bar, increasing the odds of a breakout below the April low.
- The Bulls want the Bears to be disappointed by the pullback from the April low. They are hopeful that there are enough disappointed bears interested in buying back shorts, which would cause the market to create a double bottom.
- Overall, the odds favor the Bears getting a disappointment bar today. However, traders must be prepared for the exact opposite and a strong follow-through bar.
Emini 5-minute chart and what to expect today
- The Globex market has gone sideways for most of the overnight session.
- Yesterday’s bear selloff was climactic. There is a 75% chance of two hours of sideways trading beginning before the end of the second hour.
- There is a 50% chance of follow-through selling on the open and two hours of sideways trading beginning before the end of the second hour.
- There is only a 25% strong follow-through bar today.
- The FOMC report is at 2:00 PM EST today. The market may go sideways up until the report and create a strong breakout up or down when the report is released.
- Traders should stop trading at least 30 minutes before the report.
- FOMC reports often reverse after the initial 5-minute report bar. This means traders should wait to see the 2nd bar following the FOMC.
- The risk is also big during the FOMC. Traders should consider trading 20% of their normal position size.
- Overall, traders should assume that the open will have a lot of trading range price action leading up to the report at 2:00 PM EST.
Emini Intra-Day Update
- The market gapped down on the open and is trying to break out below yesterday’s low. However, the market is far from the 5-minute 20-period moving average.
- This increases the chances of a bounce over the next few hours, and the market gets closer to the moving average.
- Bar 7: the market is forming a small pullback bear trend. However, it looks like a bear leg in what will become a trading range. Traders should expect a test of the moving average soon.
Yesterday’s Emini setups

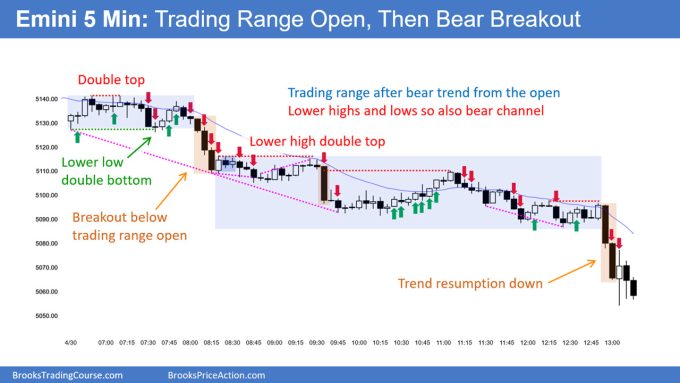
Al created the SP500 Emini charts.
Here are reasonable stop entry setups from yesterday. I show each buy entry bar with a green arrow and each sell entry bar with a red arrow. Buyers of both the Brooks Trading Course and Encyclopedia of Chart Patterns have access to a near 4-year library of more detailed explanations of swing trade setups (see Online Course/BTC Daily Setups). Encyclopedia members get current daily charts added to Encyclopedia.
My goal with these charts is to present an Always In perspective. If a trader was trying to be Always In or nearly Always In a position all day, and he was not currently in the market, these entries would be logical times for him to enter. These therefore are swing entries.
It is important to understand that most swing setups do not lead to swing trades. As soon as traders are disappointed, many exit. Those who exit prefer to get out with a small profit (scalp), but often have to exit with a small loss.
If the risk is too big for your account, you should wait for trades with less risk or trade an alternative market like the Micro Emini.
EURUSD Forex market trading strategies
EURUSD Forex daily chart
- The EURUSD formed a bear bar yesterday, closing on its low. However, today is getting bad follow-through.
- While the bears did a good job getting a strong-looking bear bar yesterday, it is in the middle of a tight trading range.
- Traders are waiting to see what kind of follow-through bar today is.
- If today is a strong bull reversal bar, that would increase the chances of bears exiting above today’s bar.
- However, if the bar is weak, the bears may get a second leg down.
- Because today is an FOMC day, there is an added risk that today can look completely different than it does right now (9:50 AM EST).
Summary of today’s S&P Emini price action

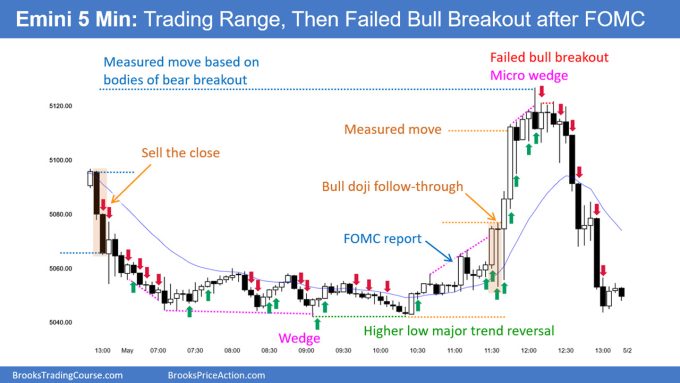
Al created the SP500 Emini charts.
End of day video review
End Of Day Review will be presented in the Trading Room today. See below for details on how to sign up.
See the weekly update for a discussion of the price action on the weekly chart and for what to expect going into next week.
Trading Room
Al Brooks and other presenters talk about the detailed Emini price action real-time each day in the BrooksPriceAction.com trading room days. We offer a 2 day free trial.
Charts use Pacific Time
When times are mentioned, it is USA Pacific Time. The Emini day session charts begin at 6:30 am PT and end at 1:15 pm PT which is 15 minutes after the NYSE closes. You can read background information on the market reports on the Market Update page.


the harder it goes down the harder it goes up – the best buy signal is a bear bar – it is roughly 3x easier to make money on the bull side than the bear – higher lows forever – trying to get a second leg down is like stepping on a coiled spring
The long-term bull trend of the equity markets is completely irrelevant on the time scale of day trading.
That’s not true. Equity markets always go down far harder than they go up. Yes, the long term trend is always up, but when stock indices go down, they simply collapse.
The reason for this is most of the world (the public and all pension funds – I’m not talking about hedge funds) is always long on equity. Which means it’s very easy to shake the market on the down side. A little fall and total panic, which cause more fall.
The move up is always slow and painstaking, because they cannot shake the public out on the long side.
Markets move fast in the direction of pain. There is no pain on the long side of equity.