Emini bull flag in buy climax after FOMC Fed rate hike
Updated 6:56 a.m.
The Emini gapped up on the open to within 4 points of the all-time high. Yet, it formed a small bear doji bar. This one bar is enough to increase the odds of a lot of trading range price action today. The Emini gapped up to just below a major magnet, but lacked enthusiasm.
The Emini had bad follow-through after other bull bars as well. While it is Always In Long, this increases the chances that this early rally will either reverse or become a bull leg in a trading range. Despite the gap up and early rally, the odds are against a strong bull trend day. Furthermore, the alternating bull and bear bars increase the chances of a trading range open.
The odds are that the Emini will be sideways for the 1st hour or two. Furthermore, it looks like it will be mostly a trading range day. If there is instead a strong breakout up or down, today could still become a strong trend day. At the moment, that is not likely.
Pre-Open market analysis
The Emini is in a bull trend on all higher time frames. Furthermore, Thursday was a strong bull trend bar on the daily chart that reversed up from the daily moving average. In addition, it was a double bottom with the low from the week earlier. It is therefore a buy signal bar in a bull trend.
Yet, because the weekly chart is so exceptionally overbought, the odds are against a big breakout above the all-time high. In addition, there is a nested wedge top on the daily chart. Hence, the Emini will probably begin to trade down to the March low soon. That will probably become the bottom of a trading range that lasts for several months. However, there is no top yet. In addition, the Emini might make one more new high before reversing down.
Overnight Emini Globex trading
The Emini is up 8 points in the Globex market. Today will therefore probably gap up. The reversal up from the daily moving average on Thursday was strong. Furthermore, the momentum up in May was strong. The all-time high is only a few points above the current price. Consequently, the Emini will probably test and break above the all-time high today or tomorrow.
Yet, because the weekly chart is so unusually overbought, the bull breakout will probably fail. The June trading range will therefore likely be the final bull flag.
If there is a reversal down from a new high, the 1st target is the bottom of the final flag, which is the June 9 low. Since the March – April trading range will probably be a larger final flag, the next target would be the March 27 bottom of that trading range.
Friday’s setups
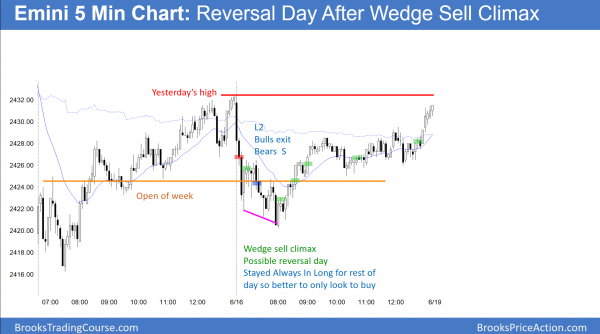
Here are several reasonable stop entry setups from Friday. The Emini reversed down strongly from a test of Thursday’s high. It then rallied from a wedge bottom to form a reversal day.
EURUSD Forex market trading strategies
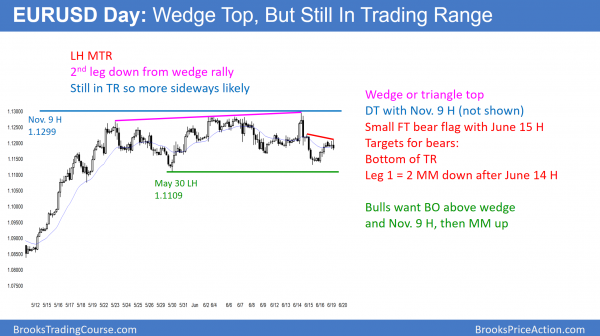
The 240 minute EURUSD chart is still in a trading range. The bulls see a 5 week bull flag. The bears see a wedge top and now a lower high major trend reversal. Since the market has inertia, sideways is most likely for at least a few more days.
The EURUSD daily chart stopped just 4 pips below the November 9 lower high. The bears therefore want a big double top. The bears also want a small double top bear flag with the June 15 top of the sell climax.
The bulls see a pullback from a test of the major resistance of the November 9 major lower high. The momentum up in May was strong. In addition, the weekly chart has been in a trading range for 2 years. Furthermore, legs in trading ranges often go above resistance before reversing Consequently, the odds still favor a break above the November high within a few weeks.
Trading ranges resist change
Yet, the odds are that the 2 year trading range will continue. Hence, the bull breakout will probably just be part of the 6 month bull leg in the 2 year trading range. Therefore the odds are against the start of a bull trend on the daily or weekly charts.
If the bears break strongly below the May 30 bottom of the trading range, then the odds would favor a test down below lower support. That includes the breakout point above the March 31 top of the 5 month trading range.
Since markets have inertia, the odds are that they will continue to do what they have been doing. The daily chart has been going sideways for 5 weeks. It has reversed every couple of days. Therefore, the odds are for at least several more sideways days.
Overnight EURUSD Forex trading
The EURUSD chart has been in a 30 pip range for 6 hours. The odds favor at least one more leg down after last week’s strong reversal down from a test of the November 9 major lower high. Yet, the minimum target is only the bottom of the 1st leg down. That is only about 50 pips from here.
In addition, there is still room up to the top of Thursday’s sell climax. That is always a magnet. As is always the case, there are always reasonable arguments for both bulls and bears when a market is in a trading range. The result is that whenever the market goes downs, bulls buy more and the bears take profits. When it goes up, the bears sell more and the bulls take profits. With everyone buying low, selling high, and scalping, trading ranges can last a long time.
Because the moves have been small overnight and the market is in the middle of its 4 week range, day traders will mostly scalp.
The odds favor a test down to the bottom of the 4 week trading range over the next few days. However, the bulls will probably get a bounce there. They will try to create a double bottom bull flag on the daily chart with the May 30 low.
Summary of today’s S&P Emini futures price action and what to expect tomorrow
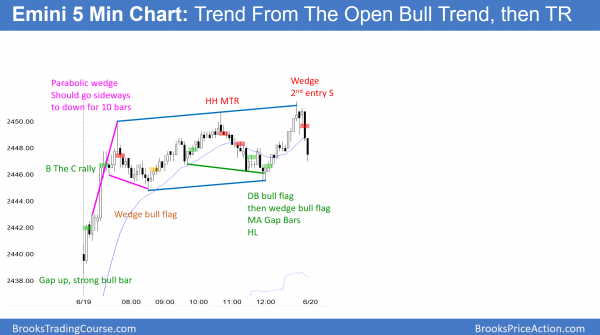
The Emini gapped up and had a trend from the open bull trend to a new all-time high. After a parabolic wedge top, it became a broad bull channel.
The Emini gapped up and broke to a new all-time high above the 3 week trading range. While the daily chart is bullish, the weekly chart is historically climactic. The odds are that the Emini will begin trading down within the next few weeks. The selloff will probably last for a few months and test the May and possibly March low.
See the weekly update for a discussion of the price action on the weekly candlestick chart and for what to expect going into next week.
Traders can see the end of the day bar-by-bar price action report by signing up for free at BrooksPriceAction.com. I talk about the detailed S&P Emini futures price action real-time throughout the day in the BrooksPriceAction.com trading room. We offer a 2 day free trial.
When I mention time, it is USA Pacific Standard Time (the Emini day session opens at 6:30 am PST, and closes at 1:15 pm PST). You can read background information on the intraday market reports on the Intraday Market Update page.


