Emini in breakout mode awaiting March FOMC announcement
Updated 6:45 a.m.
By gapping below Friday’s low, the Emini triggered a sell signal on the weekly chart. The bulls tried for a reversal on the 2nd bar, but it had a tail. While the Emini is Always In Short, the bulls will try for an early low of the day. Since the 2nd bar had a tail, the bulls might need a 2nd entry buy. An early low only means that the selling stops. It can lead to a trading range instead of a bull trend.
The 2 big bear bars on the open make a strong bull trend day unlikely. The bears hope that this is the start of a big bear day. Traders are selling aggressively. Since the bars are big, they are climactic. This increases the chances of a parabolic wedge bottom in the 1st hour. Traders will look for an early reversal. The bad follow-through on the 2nd and 4th bars reduce the chance of a sustained bear trend day.
Pre-Open market analysis
Last week was a bear bar on the weekly chart. It is a sell signal bar for a Low 2 bear flag. This week will probably trade below last week’s low, which would trigger the sell signal. But, the weekly chart is in a tight trading range. This is a limit order market. The probability is that the tight range will continue. Therefore, this sell signal is more likely to fail than to be the start of a bear trend.
Friday was the 5th consecutive bear day on the daily chart. That has not happened since August. Consequently, the odds favor a bull day today, which means a close above the open. Therefore, the Emini will probably trend up from the open, or be a trading range day where any selloff below the open will reverse up.
The big event this week is the FOMC announcement at 11 a.m. on Wednesday. The Emini will probably be sideways until then. It might use the announcement as a catalyst for a strong breakout above the February 27 major lower high or for a strong reversal down to test the March 2 low.
Overnight Emini Globex trading
The Emini is down 13 points in the Globex session. Because it will probably gap below last week’s low, it will trigger the sell signal on the weekly chart. Since this is a sell signal, there is a slightly increased chance of a big trend down this week. However, any big move up or down will probably only begin after Wednesday’s 11 a.m. FOMC announcement. Sine that is a major catalyst, it increases the odds of mostly sideways trading before the report.
After 5 consecutive bear days on the daily chart in a 3 month trading range, the odds are against a 6th consecutive bear day. Therefore, today will probably close above its open. Consequently, even if today is in a bear trend for several hours, the odds will favor a reversal up.
If there is a Small Pullback Bear Trend, which is unlikely, the day could remain a bear trend day. More likely, the bulls will get a reversal up after any 2 – 3 hour selloff on the open. If there is a rally on the open, any late selloff will probably not lead to a close below the open. Finally, if today is a trading range day, it will probably close above the open.
After 11 a.m., if the Emini is 5 points or less above or below the open, it will probably get drawn to the open as a test. Yet, the odds still favor a close above the open.
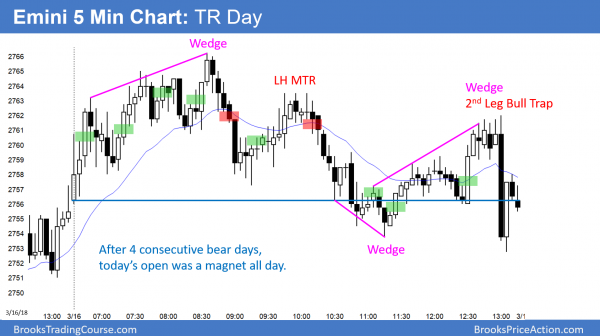
Friday’s setups
Here are several reasonable stop entry setups from Friday. I sometimes also show limit order entries and entries on the close of bars.
EURUSD High 2 bull flag
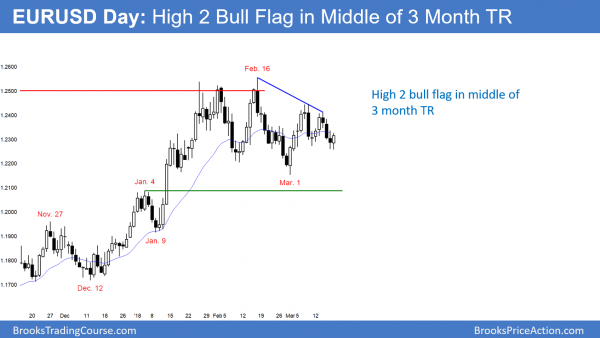
The EURUSD daily Forex chart has a High 2 bull flag in the middle of a 3 month trading range.
The EURUSD daily Forex chart has been sideways for 3 months. Like all trading ranges, the bulls look like they are about to take control, but then there is a reversal down. Once the bears look strong, the chart reverses back up.
The chart has pulled back over the past 2 weeks and has a bull bar so far today. If today closes above its midpoint, it will be a buy signal bar for tomorrow.
The past 3 months formed a trading range on the daily. Once a pullback grows to 20 or more bars, the bulls have largely lost control. I then use the term “trading range” instead of “pullback.” This is a neutral pattern. Since the trend leading to the range was up, there is only a slightly higher probability of a successful bull breakout.
However, these same few months on the daily chart created a bull flag on the weekly chart. The weekly chart is therefore bullish. The odds favor a successful upside breakout within the next month or two. If the pullback grows to 20 or more weeks, it too will become neutral, like the pattern on the daily chart. I will then call it a trading range instead of a pullback (bull flag).
If the bears get a successful bear breakout on the daily chart, they could get a Leg 1 = Leg 2 measured move down on to around 1.20. While bearish on the daily chart, it would still be a bull flag on the weekly chart. But, a weaker one.
Overnight EURUSD Forex trading
The EURUSD 5 minute Forex chart rallied 60 pips overnight up from below Friday’s low. In addition, there was a 15 minute bull breakout over the past hour. If the bulls can prevent this breakout from reversing, the day will close near its high. It would therefore be a good buy signal bar for a lower low double bottom with the March 9 low. The odds would favor a break above today’s high tomorrow.
The big problem for all traders is that 11 a.m. Wednesday’s FOMC announcement if a major catalyst. It could lead to a big move up or down. Consequently, what takes place before the report is minor.
Yes, the odds of a rally to above 1.25 will be higher if today closes on its high and tomorrow is a big bull day. Wednesday’s report could then lead to a huge rally to back above 1.25.
However, it is almost equally likely that the report will lead to a big reversal down to below 1.20. Consequently, day traders will mostly scalp until the report.
Summary of today’s S&P Emini futures price action and what to expect tomorrow
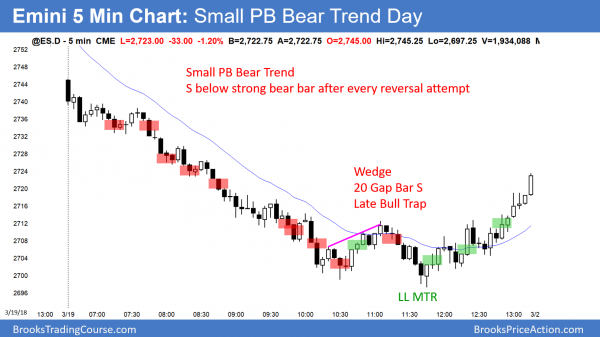
The Emini gapped down and created a Small Pullback Bear Trend Day. A late rally retraced half of the early loss.
By gapping down, today created a 6 day island top. In addition, it triggered a sell signal on the weekly chart. The bears want follow-through selling tomorrow. But, today was the 6th consecutive bear day. That has not happened in over a year. The odds are that today’s sell climax will lead to at least a small bull day tomorrow. That simply means a close above the open. Less likely, tomorrow could be a big bull day, erasing much of today’s selling.
See the weekly update for a discussion of the price action on the weekly candlestick chart and for what to expect going into next week.
Traders can see the end of the day bar-by-bar price action report by signing up for free at BrooksPriceAction.com. I talk about the detailed S&P Emini futures price action real-time throughout the day in the BrooksPriceAction.com trading room. We offer a 2 day free trial.
When I mention time, it is USA Pacific Standard Time (the Emini day session opens at 6:30 am PST, and closes at 1:15 pm PST). You can read background information on the intraday market reports on the Intraday Market Update page.


