Trading Update: Tuesday December 13, 2022
Emini pre-open market analysis
Emini daily chart
- Update after 5:30 AM PT Report Bar: The Globex Market had a 130-point breakout during Globex session going to a new high above December 1. Traders will pay attention to today’s close to see if the bulls can get a close on high or if today will be disappointing for the bulls. As surprising as today’s pre-market breakout is, bulls may use it to take profits by betting on a wedge top on the daily chart.
- The Emini is reversing up after the micro double bottom following the five-bar bear micro channel. More likely, there will be sellers above the December 6 high as traders expect a second leg down after the five-bar bear micro channel that began after the wedge top ending on November 30.
- Because of the trading range price action, some of those bears want to sell above a bar like December 6.
- The bears selling the December 6 high understand that the market may have to test higher up and are willing to scale in higher.
- The bulls want the current rally to test the December 1 low at a minimum. This is where traders got trapped buying the December 1 low. Since the December 1 low is a reasonable target, the market may have to get there, and if it does, it will likely become resistant.
- Bulls were disappointed buying the December 1 low and will likely sell out of longs. Bears know this and will also look to sell the December 1 high.
- Overall, traders should expect sideways over the next few days. However, enough of a surprise bar to lead to a second leg up; however, the rally will likely be limited.
Emini 5-minute chart and what to expect today
- Emini is up 130 points in the overnight Globex session.
- The market rallied 130 points in less than 10 minutes during the 5 AM PT report.
- The market will have a big gap up at the start of the U.S. Session.
- The surprise bar, which during the report is extremely climactic, will likely lead to profit taking and more sideways than a strong rally today.
- Traders should assume the day will have a lot of trading range price action, especially since bulls will likely use this morning’s report to take profits on the daily chart.
- The bars may be prominent today, so traders should use caution and trade small.
- As always, traders should consider waiting for 6-12 bars before placing a trade.
- Traders can also wait for a double top/bottom or a wedge top/bottom before placing a stop entry for a swing trade.
Yesterday’s Emini setups

Al created the SP500 Emini charts.
Here are several reasonable stop entry setups from yesterday. I show each buy entry with a green rectangle and each sell entry with a red rectangle. Buyers of both the Brooks Trading Course and Encyclopedia of Chart Patterns have access to a much more detailed explanation of the swing trades for each day (see Online Course/BTC Daily Setups).
My goal with these charts is to present an Always In perspective. If a trader was trying to be Always In or nearly Always In a position all day, and he was not currently in the market, these entries would be logical times for him to enter. These therefore are swing entries.
It is important to understand that most swing setups do not lead to swing trades. As soon as traders are disappointed, many exit. Those who exit prefer to get out with a small profit (scalp), but often have to exit with a small loss.
If the risk is too big for your account, you should wait for trades with less risk or trade an alternative market like the Micro Emini.
EURUSD Forex market trading strategies
EURUSD Forex daily chart

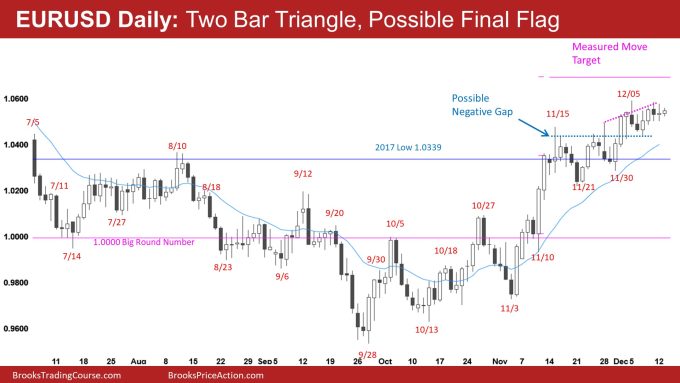
- The market is in a bull channel, and the bulls are trying their best to reach the measured move target above (1.0700).
- The market is forming a triangle over the past two trading days. This increases the odds that an upside breakout will lead to a final flag.
- The bulls want the small pullback bull trend to continue and the negative gap (blue line) to lead to a measured move up. The small pullback bull trend will likely lead to a trading range, and the market will have to test down for a couple of legs.
- Price has been away from the moving average for 22 bars which is a sign of bull strength. However, it is climactic, which means the odds are that the market will have to test the moving average soon.
- The weekly chart has been in a tight bear channel since July 2021. While the rally from the October low is strong, it will likely need to a pullback and form a higher low to satisfy a retest of the lows.
- As strong as the rally has been over the past two months, it is likely minor, and traders will expect a pullback to form a higher low.
- Traders will likely want to see the pullback go below 1.0200 at a minimum to satisfy that the pullback is a possible higher low major trend reversal.
- Overall, the market will probably convert into a trading range soon, regardless of if the market has to reach the 1.0700 measured move target first.
Summary of today’s S&P Emini futures price action and what to expect tomorrow

Al created the SP500 Emini charts.
End of day review
- I will update at the end of the day.
See the weekly update for a discussion of the price action on the weekly chart and for what to expect going into next week.
Trading Room
Traders can see the end of the day bar-by-bar price action report by signing up for free at BrooksPriceAction.com. Al talks about the detailed S&P Emini futures price action real-time throughout the day in the BrooksPriceAction.com on trading room days. We offer a 2 day free trial.
Charts use Pacific Time
When times are mentioned, it is USA Pacific Time. The Emini day session charts begin at 6:30 am PT and end at 1:15 pm PT which is 15 minutes after the NYSE closes. You can read background information on the market reports on the Market Update page.


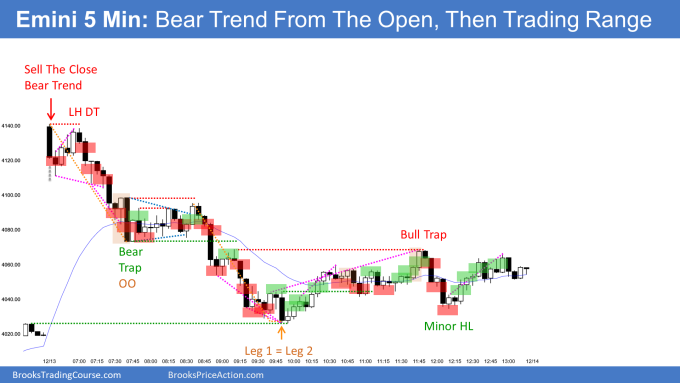
Ok I felt stupid today. I thought today would be a bull trend since it is such a massive bull breakout. I didn’t realize it turned out to be a bear trend.
I was so stubborn thinking that it’s just a pullback.
Only when I see a second leg down that I realize that it’s not a pullback but a reversal.
Hi Huey!
Its important remember that:
– BO on Open: 80% have minor reversal and 50% have major reversal, no matter how strong.
– The first bar was a big bear trend bar and second bar was a bear bar, so you should expect a fail breakout or at least deep PB at EMA, but look bar 6 to bar 12, market down in micro channel with gaps between 6-8, 9-11 and 10-12/13 so probably first reversal be minor.
– When you have a big gap up (or gap down) you can expect 4 common outcomes: D.B. near EMA; D.T; Wedge Bottom near EMA and Wedge Top. Reversals on open are common, today was D.T.
When the market went below bar 6 there was no longer any reason to buy. Second entry short and a DT after a climactic rally. At the very least expect a test of the moving average.