Trading Update: Friday October 20, 2023
S&P Emini pre-open market analysis
Emini daily chart
- The Emini sold off yesterday breakout below a bull flag. The bears are hopeful they will be able to get a measured move down of the recent tight trading range, and a test of the October low.
- The bears have consecutive bear bars, which is good, however, the bears need to do more to make the market Always In Short. Any selloff will likely be a test of the bottom of a trading range, and there will be buyers below the October low.
- The midpoint of the rally that began in October 2022 is 4,172 which is only around 120 points away.
- This would be a reasonable target for the bears and it would also create a clear wedge on the daily chart with the August 18th low and the October 6th low.
- It is essential that the bulls could make money buying below the August 18th low. This means that the breakout point (August 18th low) closed. The odds will favor buyers below the October 6th low as well.
- Overall, the Bears have done an excellent job over the past two days but need to do more. Because of the consecutive bear bars on the daily chart, the odds favor the sellers above. However, if the bulls get a strong reversal bar closing on its high, it might force bears to exit.
Emini 5-minute chart and what to expect today
- Emini is down 4 points in the overnight Globex session.
- The overnight Globex market formed a large expanded triangle. At 7:30 AM EST, the bears failed to break below the lows of the Globex session, and the market reversed up.
- The want today rallied far above yesterday’s low, which would create a failed breakout on the daily chart after yesterday’s bear breakout.
- As of 7:05 AM EST, the Emini is in the middle of the Globex trading range. The middle of a trading range is not ideal for establishing a position. This means traders should look to buy lower or buy after the rally has increased in strength.
- As always, traders should expect a trading range open. There is an 80% chance of a trading range open and only a 20% chance of a trend from the open.
- If today is going to be a strong trend up or down, there will be plenty of time to establish a position in the direction of the trend.
- Most traders should consider not trading for the first 6 – 12 bars due to the odds favoring a limit order market.
- It is common for the market to form the opening swing trade sometime before the end of the second hour. A trader can often wait for a double top/bottom or a wedge top/bottom before their opening swing begins.
- Lastly, today is Friday, so weekly support and resistance are essential. Traders should pay attention to last week’s low, as it will likely be a magnet for the bulls. Traders should be prepared for a possible surprise breakout up or down late in the day as traders decide on the close of the weekly chart.
Yesterday’s Emini setups

Richard created the SP500 Emini charts (Al on leave).
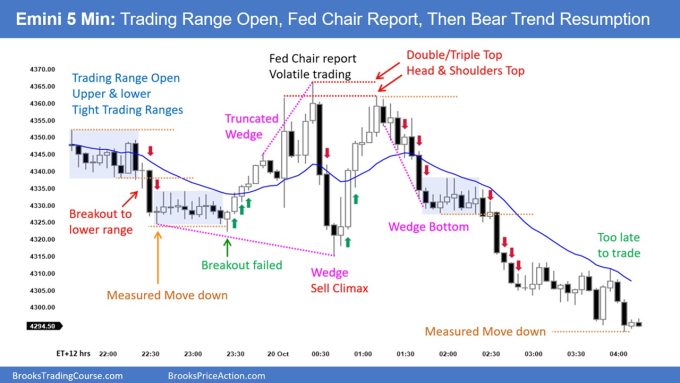
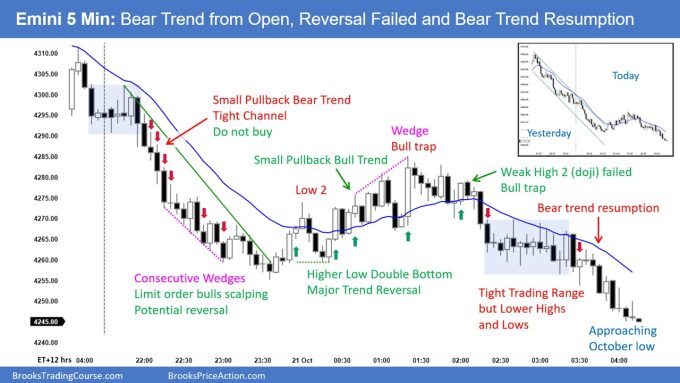
Here are reasonable stop entry setups from yesterday. I show each buy entry with a green arrow and each sell entry with a red arrow. Buyers of both the Brooks Trading Course and Encyclopedia of Chart Patterns have access to a near 4-year library of more detailed explanations of swing trade setups (see Online Course/BTC Daily Setups). Encyclopedia members get current daily charts added to Encyclopedia.
My goal with these charts is to present an Always In perspective. If a trader was trying to be Always In or nearly Always In a position all day, and he was not currently in the market, these entries would be logical times for him to enter. These therefore are swing entries.
It is important to understand that most swing setups do not lead to swing trades. As soon as traders are disappointed, many exit. Those who exit prefer to get out with a small profit (scalp), but often have to exit with a small loss.
If the risk is too big for your account, you should wait for trades with less risk or trade an alternative market like the Micro Emini.
EURUSD Forex market trading strategies
EURUSD Forex daily chart
- The EURUSD continues to go sideways in a tight trading range, just under the moving average.
- Tight trading ranges contain terrible stop-entry setups and traders should assume both bulls and bears have a 50% probability up or down.
- The bulls want the upside breakout above the moving average, and the bears want the opposite.
- If the bears do get the downside breakout, bulls will see the recent tight trading range as a possible final flag.
- Until one side gets two to three consecutive strong trend bars up or down, the odds will favor more sideways trading.
Summary of today’s S&P Emini price action

Richard created the SP500 Emini charts (Al on leave).
See the weekly update for a discussion of the price action on the weekly chart and for what to expect going into next week.
Trading Room
Al Brooks and other presenters talk about the detailed Emini price action real-time each day in the BrooksPriceAction.com trading room days. We offer a 2 day free trial.
Charts use Pacific Time
When times are mentioned, it is USA Pacific Time. The Emini day session charts begin at 6:30 am PT and end at 1:15 pm PT which is 15 minutes after the NYSE closes. You can read background information on the market reports on the Market Update page.


Thanks for the chart Richard!
With bar 46 being the bull trap as it turned out to be (evidenced by the inside bar 47, and the dojis after it), I would think that with bulls exiting at bar 51 and the strong bear bar that followed would signal a second entry for the bears (bar 51 was the first). In other words, marking bar 54 as a buy entry seems suspect. Bars 51, 53 and 55 would look more suitable as entries for shorts.
All best!
I agree, and I think you could even sell the close of 47, with bar 20, 30 and 42 being a wedge (and 35, 38 and 42 being a nested wedge), bar 47 is a failed BO above nested wedge. Higher probability bar 53 (now micro head and shoulders top).
Thank You