Trading Update: Tuesday February 27, 2024
S&P Emini pre-open market analysis
Emini daily chart
- Yesterday, the bears managed to get follow-through selling, following last Friday’s bear reversal bar.
- The bears are hopeful that yesterday is the start of the bulls giving up and a selloff back down to the moving average.
- The problem that the bears have is the bull channel is tight, which will reduce the probability of the bears getting a strong downside breakout.
- There are probably bulls buying below and willing to scale in lower. However, those bulls may not be interested in buying until the market gets closer to the daily moving average.
- The bears need to do more to show they are in control. At a minimum, they need to get back to the moving average. It would be better if the bears form a strong downside breakout over the next day or two that falls below the February 21st major higher low. More likely, the bears will be disappointed over the next couple of days.
- The bulls want the market to continue to form higher lows and higher highs. They will continue to buy pullbacks, trying to create higher lows.
- Most bears want to sell more selling pressure, such as consecutive closes below the moving average, before they will be interested in selling.
Emini 5-minute chart and what to expect today
- Emini is up 6 points in the overnight Globex session.
- The Globex market has gone sideways for most of the overnight session.
- Traders should expect today to have a lot of trading range price action as the market decides on whether the bears will get continued follow-through or if the bulls will get a reversal.
- There is an 80% chance of a trading range open and only a 20% chance of a trend from the open.
- Most traders should wait for 6-12 bars before placing a trade and focus on catching the opening swing that often begins before the end of the second hour.
- It is common for the market to form a double top/bottom or a wedge top/bottom before the opening swing begins. This means that a trader can often wait for the above mentioned pattern to form and enter the swing trade on a stop entry.
- The opening swing is important because it provides great risk-reward with decent probability. It is common for the opening swing that last two legs and at least two hours.
Yesterday’s Emini setups

Al created the SP500 Emini charts.
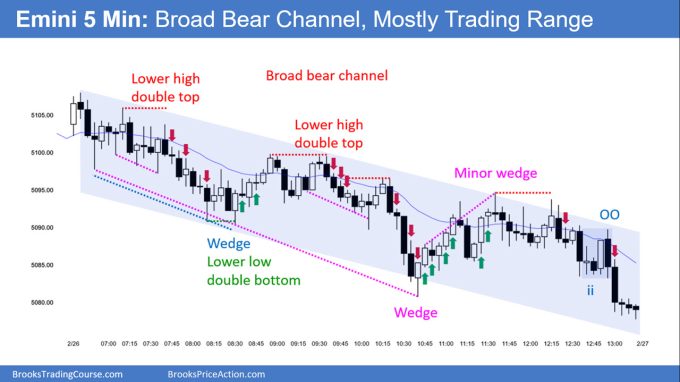
Here are reasonable stop entry setups from yesterday. I show each buy entry bar with a green arrow and each sell entry bar with a red arrow. Buyers of both the Brooks Trading Course and Encyclopedia of Chart Patterns have access to a near 4-year library of more detailed explanations of swing trade setups (see Online Course/BTC Daily Setups). Encyclopedia members get current daily charts added to Encyclopedia.
My goal with these charts is to present an Always In perspective. If a trader was trying to be Always In or nearly Always In a position all day, and he was not currently in the market, these entries would be logical times for him to enter. These therefore are swing entries.
It is important to understand that most swing setups do not lead to swing trades. As soon as traders are disappointed, many exit. Those who exit prefer to get out with a small profit (scalp), but often have to exit with a small loss.
If the risk is too big for your account, you should wait for trades with less risk or trade an alternative market like the Micro Emini.
EURUSD Forex market trading strategies
EURUSD Forex daily chart

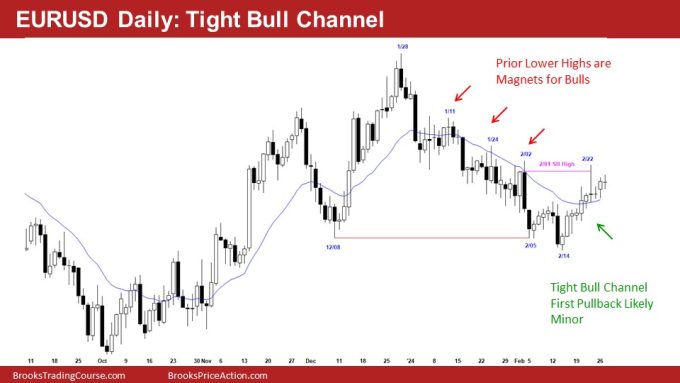
- The EURUSD is forming a tight bull microchannel above the moving average.
- While the daily chart is probably Always In Long, it is likely going to go sideways in a tight trading range soon.
- The Bulls have done a great job getting consecutive closes above the moving average. However, the rally has big tails above, such as on February 22nd. This increases the odds of sellers near the February 22nd high.
- Targets for the bulls are prior lower highs, as indicated on the chart.
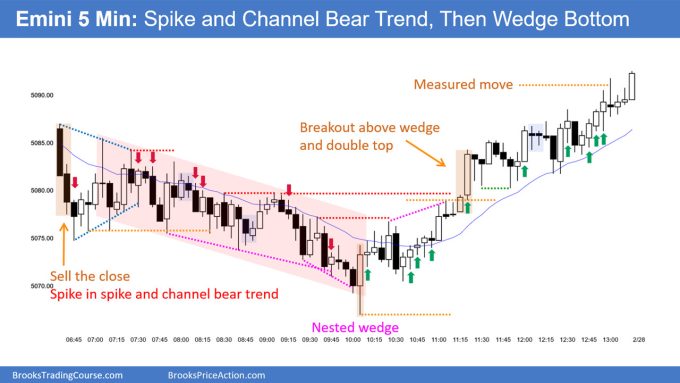
Summary of today’s S&P Emini price action

Al created the SP500 Emini charts.
See the weekly update for a discussion of the price action on the weekly chart and for what to expect going into next week.
Trading Room
Al Brooks and other presenters talk about the detailed Emini price action real-time each day in the BrooksPriceAction.com trading room days. We offer a 2 day free trial.
Charts use Pacific Time
When times are mentioned, it is USA Pacific Time. The Emini day session charts begin at 6:30 am PT and end at 1:15 pm PT which is 15 minutes after the NYSE closes. You can read background information on the market reports on the Market Update page.


For 2/26, why not long above 10 or 13 for a potential DB? Also, why short below 14 when it looks like we are in the bottom of a trading range?
I see the daily candle closed below it’s midpoint at the top of a channel which is the only reason I can see for potentially fading these DBs.
Thanks in advance for the insight. Much appreciated!