Emini 2300 all time high breakout but wedge top
Updated 6:49 a.m.
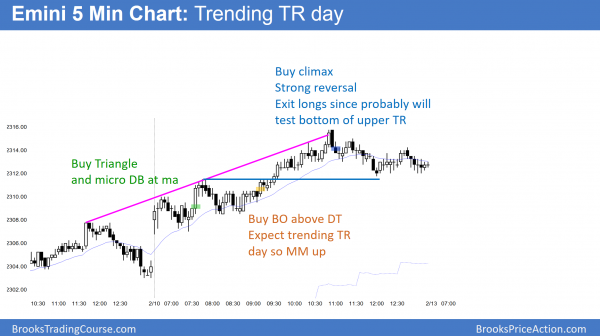
The Emini gapped up, but began with 2 bars with prominent tails. Furthermore, there was hesitation for the 1st 4 bars. The bulls want a repeat of yesterday’s early breakout. But, the bears want to continue to make money selling above prior highs.
Yesterday had a 4 hour trading range. The Emini is at the resistance of the top of the wedge channel on the daily chart. While the rally could easily continue for several more days, the odds are against a strong breakout on the daily chart. Therefore today will probably not be a strong bull trend day. Since yesterday was a strong bull breakout, the odds are against a strong bear trend day. Therefore today will probably have uncertainty and be mostly within a trading range.
Pre-Open Market Analysis
The Emini rallied strongly yesterday above the island top on the daily chart. Furthermore, it broke above the 2300 big round number and the all-time high. Because the momentum up yesterday was strong, the odds are that there will be some follow-through buying over the next day or two.
Yet, the rally was a test of the top of the wedge channel on the daily chart. Hence, the odds are that a bull breakout above the channel will fail within 5 days. Therefore, the Emini would then probably test to the bottom of the channel. In addition, the odds are that it will test the December 30 major higher low within a couple of months. Since that day was also the close of 2016, the odds favor a test of last year’s close as well.
Overnight Globex trading
The Emini is up 2 points in the Globex market. Because yesterday was a strong bull trend day, the odds favor at least some follow-through buying in the 1st couple of hours. Yet, the Emini now has a wedge top on the daily chart and tested the top of the channel yesterday. It furthermore broke above the resistance of the 2300 big round number. Finally, there is a gap above the August high. These factors therefore make it likely that the Emini will reverse down about 100 points over the next month or two.
Traders will begin to look for sell setups or for a strong reversal down on the daily chart. While it can come as soon as today, the top might need weeks to form. Until it does, the bulls are still in control.
EURUSD Forex Market Trading Strategies
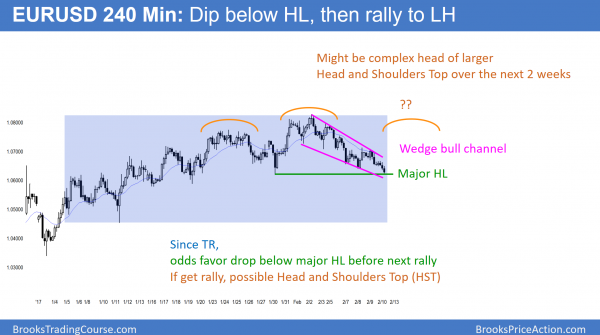
The selloff on the 240 minute EURUSD Forex chart is in a wedge bear channel. Hence, the odds favor a bull breakout. Since the chart is in a trading range, it will probably fall below the January 20 low of 1.0620 at a minimum before reversing up.
Since the EURUSD Forex market has been in a trading range for a month, it will probably have to fall below support before is begins a bull leg. The current bear leg is just above a major higher low. While it might fall below the entire trading range before reversing, the odds are that the 2 week selloff is a bear leg in a trading range, and not a resumption of the bear trend on the weekly chart.
This is because it is in a series of sell climaxes on the 240 minute chart and in a wedge bear channel. That pattern is more likely to have a bull breakout.
Yet, if it does rally for a couple of weeks to the top half of the trading range, bears will sell again. This is because bears always sell in the top of a trading range. Furthermore, they would then have a potential head and shoulders top. Therefore, they hope that the leg down from there is the start of a bear trend and not just a leg in the trading range.
Overnight EURUSD Forex trading
The EURUSD Forex market continued its weak selloff last night. In addition, it got to within 4 pips of the January 30 major higher low. It is therefore close to the buy zone. There are other major higher lows all of the way down to the January 16 low of 1.0579.
Yet, that is not far below. Since most trading range breakouts fail, the odds favor a 100 pip rally before the EURUSD falls another 50 pips or so. Bulls will look to buy a reversal up from below a major higher low.
Less likely, the 2 week selloff could fall strongly below the major higher low and test the 15 year low of last month.
Summary of today’s S&P Emini futures price action and what to expect tomorrow
The bulls got weak follow-through buying today in the form of a trending trading range day.
Yesterday was a strong bull trend. Therefore, the odds favored some follow-through buying today. Yet, the Emini on the daily chart is breaking above a wedge bull channel. There is a 75% chance this breakout will fail within 5 days.
See the weekly update for a discussion of the price action on the weekly candlestick chart and for what to expect going into next week.
Traders can see the end of the day bar-by-bar price action report by signing up for free at BrooksPriceAction.com. I talk about the detailed S&P Emini futures price action real-time throughout the day in the BrooksPriceAction.com trading room. We offer a 2 day free trial.
When I mention time, it is USA Pacific Standard Time (the Emini day session opens at 6:30 am PST, and closes at 1:15 pm PST). You can read background information on the intraday market reports on the Intraday Market Update page.


BTC Admin,
I really enjoyed the Dec 8 end of day chart with the top few swing trades highlighted. It would be great to see more of this in the future. Thanks!
Dave