Comey firing ending Trump rally around 2400 big round number
Updated 6:53 a.m.
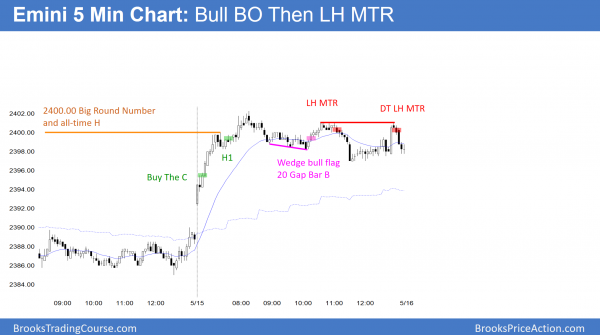
The Emini gapped above Friday’s high and opened with a big bull trend bar. Yet, the second bar was a bear doji and therefore the follow-through buying was bad. Hence, this is a continuation of the 4 weeks of trading range price action.
The next 2 bars were bull trend bars, but small. The Emini is Always In Long, but the follow-through buying is weak. This increases the chances of an opening reversal down and an early high of the day. Hence, the bears will look for a parabolic wedge top or at least a micro double top. There is no top yet. Bulls are still buying closes
The bulls need more and bigger bull bars if today will be a big bull trend day. When there is a bull breakout on the open like this, but no clear top, the Emini often enters a trading range for several hours. Then, later in the day, it decides between trend resumption up and trend reversal down.
Pre-Open market analysis
The weekly chart has an extreme buy climax. It is therefore likely to begin to pull back to its weekly moving average within a few weeks. Last week had a bear body after making a new high. It is therefore a sell signal bar for a failed breakout above the March prior all-time high. Hence, if this week trades below last week’s high, it triggers the sell signal. Furthermore, if today gaps below last week’s low, there would also be an island top.
Because the daily chart is in a converging bull channel, the odds are that it will have a 3rd push up this week. If it rallies to around 2410 at the top of the channel and reverses down, it would form a wedge higher high major trend reversal. Yet, if today trades below last week’s low, the odds will favor the start of a 5% correction instead of one more new high.
Overnight Emini Globex trading
The Emini is up 3 points in the Globex session. Since it is still in the middle of its 4 week range and most days have been trading range days, today will likely be another trading range day.
The odds still favor one more new all-time high before a 100 point selloff begins. Consequently, a 2 – 5 day rally can begin anytime. Furthermore, since the weekly chart is so extremely overbought, a strong series of bear trend days can also start anytime.
EURUSD Forex market trading strategies
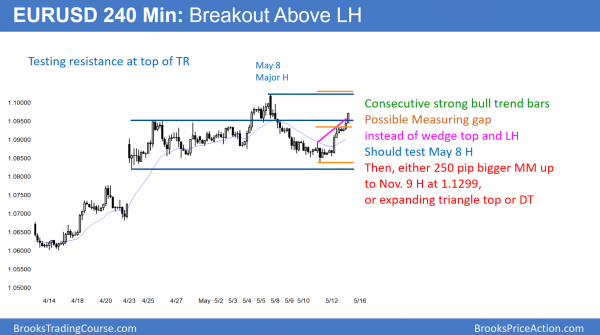
The 240 minute EURUSD Forex market rallied strongly over the past 2 days from the bottom to the top of its 4 week trading range.
After the tight bear channel to the bottom of the 4 week trading range on the 240 minute chart, the odds favored a 50% bounce. Furthermore, the chart should have tested back down. Instead, the lower probability outcome is now underway. The bulls have consecutive big bull bars at a level where a reversal down was more likely. Consequently, the odds of a reversal down from a lower high have fallen to about 50%. The bulls want a measured move to above the May 8 top of the 4 week range.
Double top or expanding top
The magnet of the 1.1299 November 9 top of the sell climax keeps pulling on the market. Yet, the bulls need a strong breakout above the May 8 top of the 4 week range. Without that, the odds favor another selloff. It could come from a double top with the May 8 high. If instead it comes from 50 – 100 pips higher, traders would sell a reversal down. This is because that would then be an expanding triangle top, where the 1st leg up was the April 25 high.
Overnight EURUSD Forex trading
The 2 day rally on the 240 minute chart is in a 6 bar bull micro channel. Therefore the bears will probably need at least a micro double top before they can take control. As a result, the downside over the next couple of days is probably 50 pips.
While the rally can continue up above the May 8 high without pulling back, that would be unusual. If the EURUSD gets to the 1.1022 May 8 top of the range today or tomorrow, it will probably enter a trading range for a day or two.
Summary of today’s S&P Emini futures price action and what to expect tomorrow
The Emini rallied on the open to a new all-time high above 2400. It then entered a tight trading range for the next 5 hours.
After a brief early rally to a new all-time high, the Emini entered a tight trading range for the rest of the day. Hence, it was in Breakout Mode. Therefore, the bulls wanted trend resumption up from a High 2 bull flag. Yet, the bears want trend reversal down from a double top lower high major trend reversal. The breakout will probably come tomorrow.
See the weekly update for a discussion of the price action on the weekly candlestick chart and for what to expect going into next week.
Traders can see the end of the day bar-by-bar price action report by signing up for free at BrooksPriceAction.com. I talk about the detailed S&P Emini futures price action real-time throughout the day in the BrooksPriceAction.com trading room. We offer a 2 day free trial.
When I mention time, it is USA Pacific Standard Time (the Emini day session opens at 6:30 am PST, and closes at 1:15 pm PST). You can read background information on the intraday market reports on the Intraday Market Update page.


Al,
could you please comment why bar 3 was AIL BTC vs bar 4. Thanks
After a strong 1st bull bar, traders were looking for a reason to buy. Many traders bought the close of 3, but I agree with you that a consecutive strong bull trend bar, like bar 4 (or 5), is a higher probability buy. Some saw 3 as confirmation of 1, but with a 1 bar pause in between.