Market Overview: FTSE 100 Futures
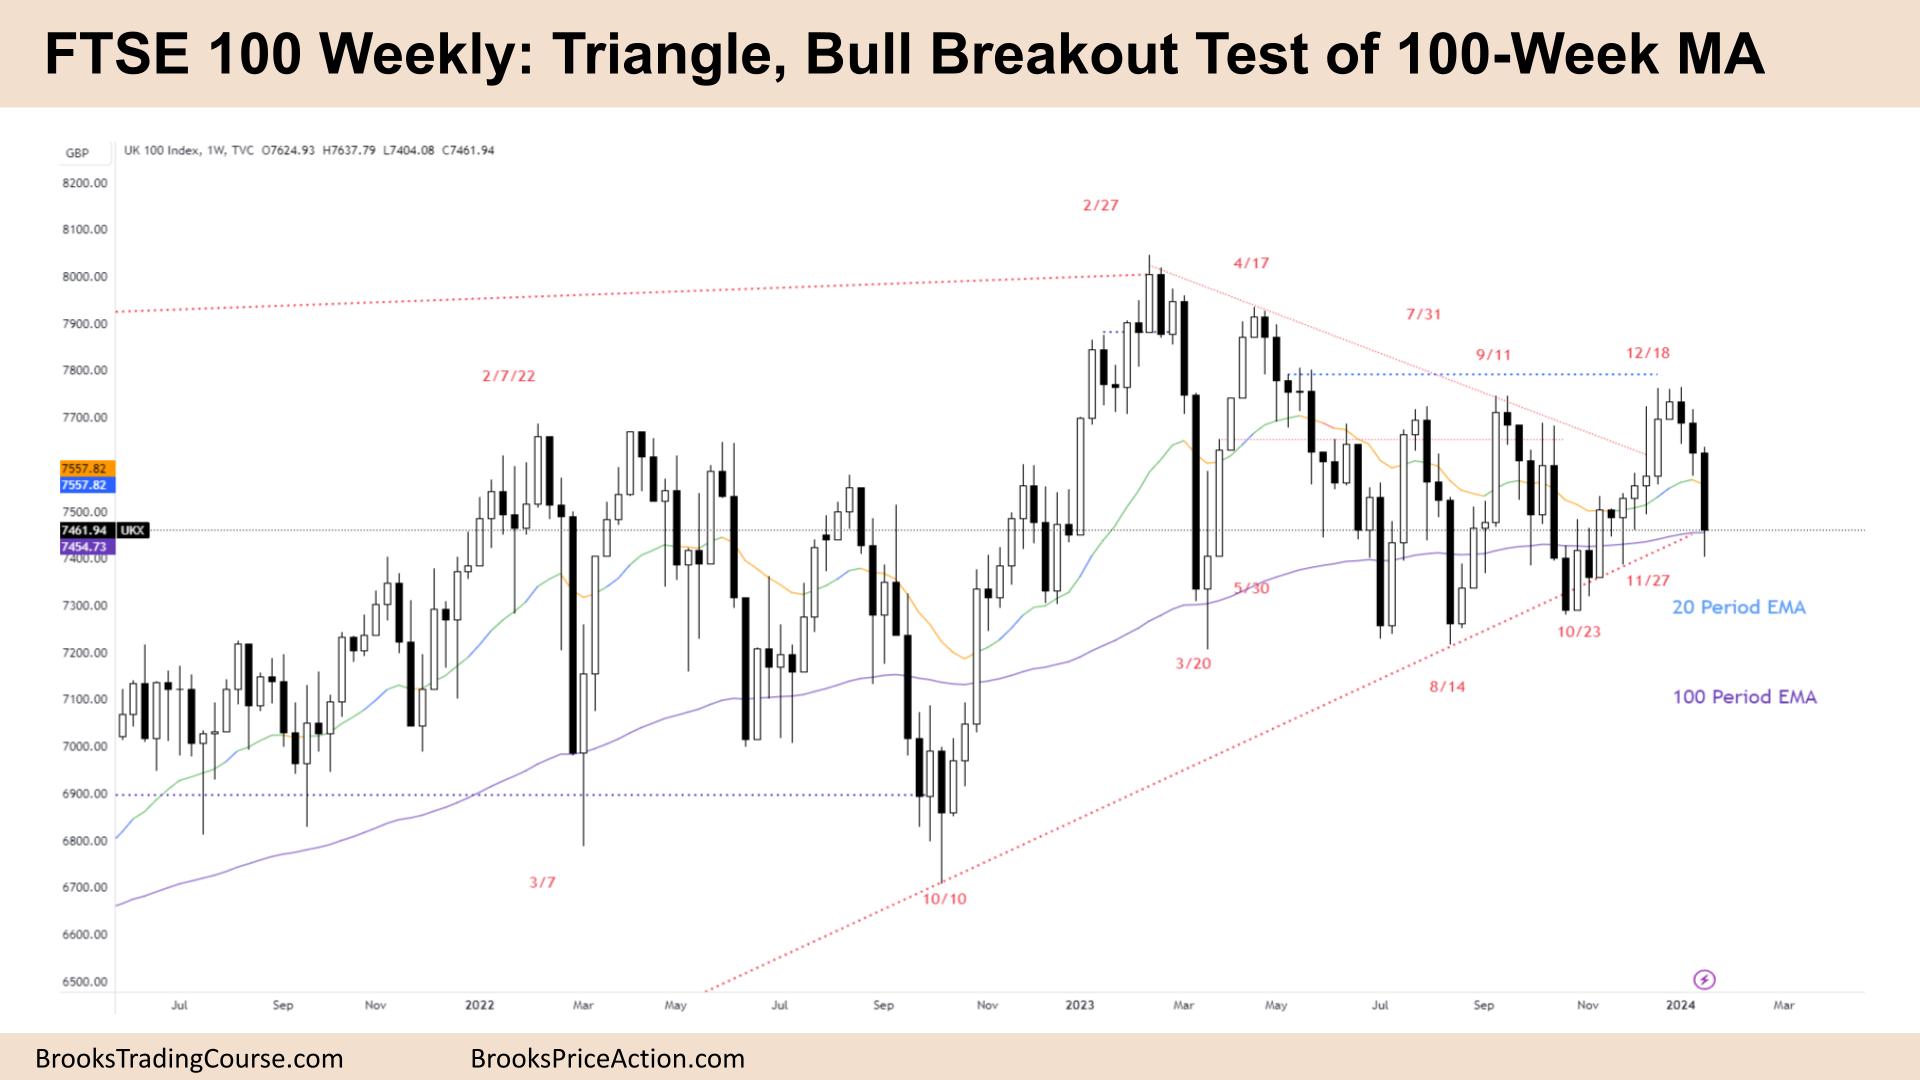
FTSE 100 futures moved lower last week back top test the apex of the triangle and the 100-week moving average (MA.) Deep pullbacks, disappointment and strong near the extremes. Trading range price action. That could lead to buyers here, as buying this MA has been a good trade historically.
FTSE 100 Futures
The Weekly FTSE chart

- The FTSE 100 futures fell back last week to test the apex of a triangle.
- It was a big bear bar closing near its low and below the 20-week MA.
- It is the 3rd consecutive bear bar, which is a surprise, and traders might expect a second leg. The second leg might only be one bar.
- It was also a large bar. That could lead to profit-taking by the bears and more sideways.
- It follows a tight bull channel. The tight bull channel should have got a second leg up and might still do.
- That makes it a deep pullback and trading range price action.
- The bulls see a broad bull channel and a break above a double top. They are looking for a measured move-up.
- The bears see a failed break above a double top, a test and are looking to return to the range lows.
- Both traders can be right because we are in a trading range and a triangle. That means it is BOM, and traders are deciding.
- If you sell here, you believe we will break strongly below the long-term MA, which has been a low-probability trade. That means we probably won’t go much further down yet.
- Buying 3 bear bars is also low-probability unless you scale in lower. So we might go sideways next week.
- Most traders should wait for a strong stop order signal.
- Are we always in short? No. Too many bull bars above the MA, so unless we go below the low of that bull spike, we are still always in long.
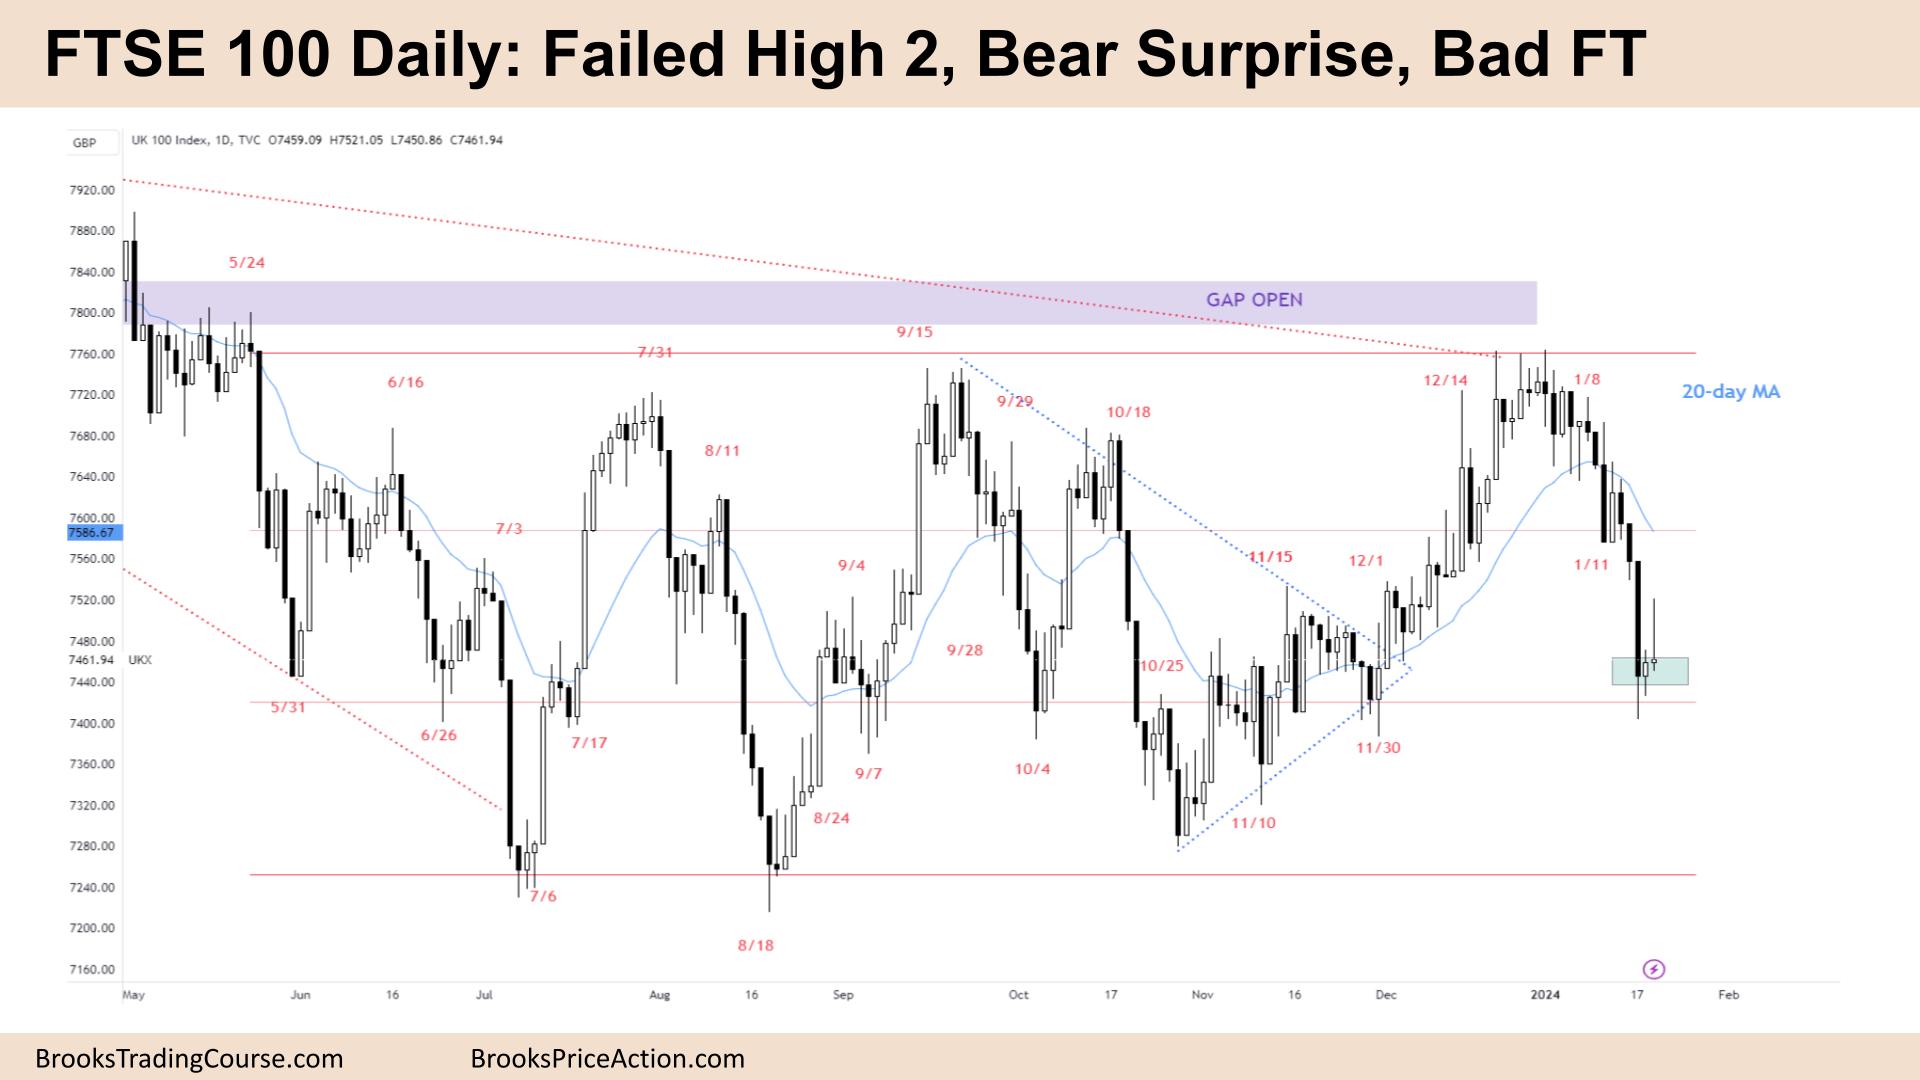
The Daily FTSE chart

- The FTSE 100 futures moved higher on Friday but sold off into the close.
- It was a reasonable buy signal as a test of a triangle.
- It mimics the weekly chart as well. It was a good area to buy after the bulls gave up earlier.
- Some bulls will wait for a second entry buy signal a little lower. Or at least wait for the bears to fail below.
- The bulls see a trading range and a failed High 2 buy high in the range. They will be looking for a High 4 – or the second attempt at a High 2.
- The buy had good context because of the HTF chart – the 200-weekly MA.
- The bears see a trading range from December, bear breakout and hit their 2:1 swing target on Wednesday.
- The bears sold back in November, and in a trading range, it was reasonable to expect to get out. We hit their breakeven point on Wednesday.
- Judging by the strong pullback, that might be it for the bears.
- The bears would like to go and let the remaining bears out next week from October and November. But after such a strong move against them, I think they will be disappointed.
- They want that to be the bottom of the trading range, lower high and then break below. But the HTF is against them.
- The bulls want to trap them here, a sell climax and small pullback trend back up.
- Always in short, so better to be short or flat.
- Expect swing bulls to start scaling in around here.
Market analysis reports archive
You can access all weekend reports on the Market Analysis page.

