Market Overview: FTSE 100 Futures
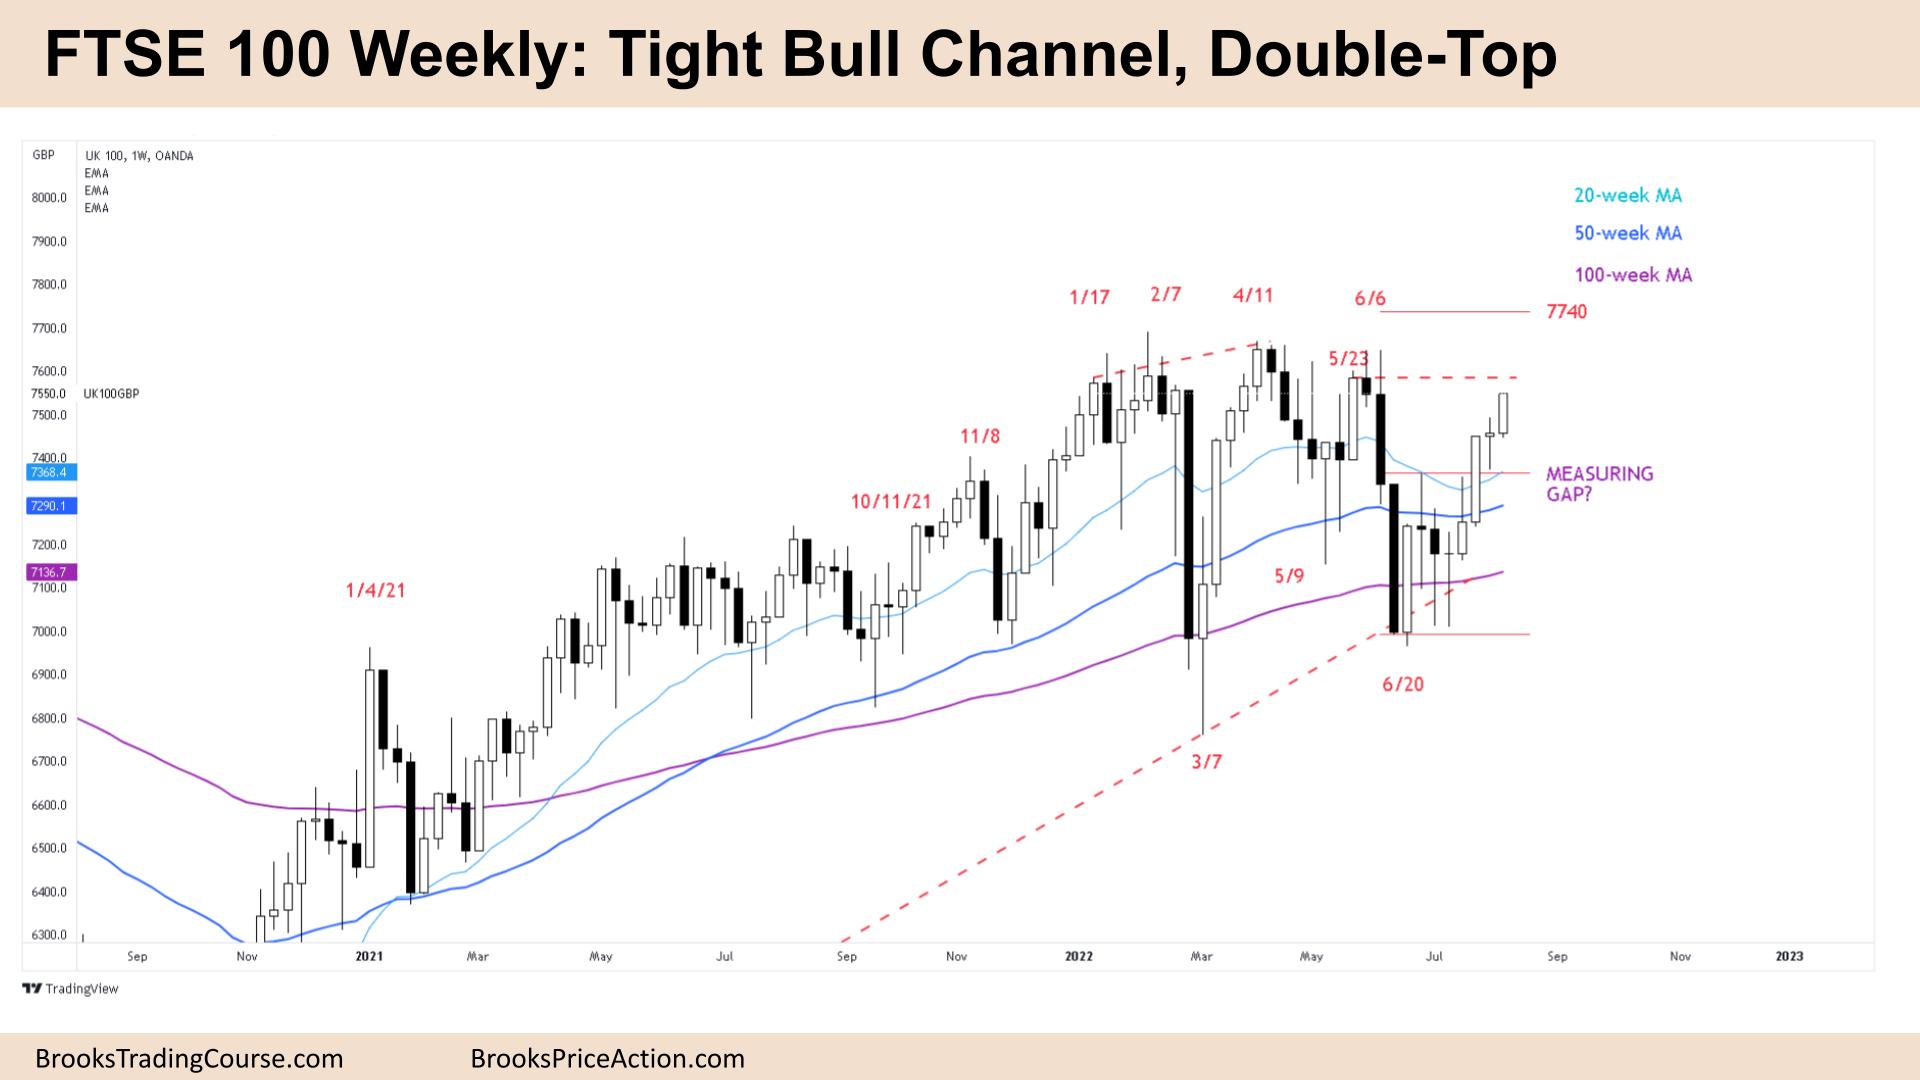
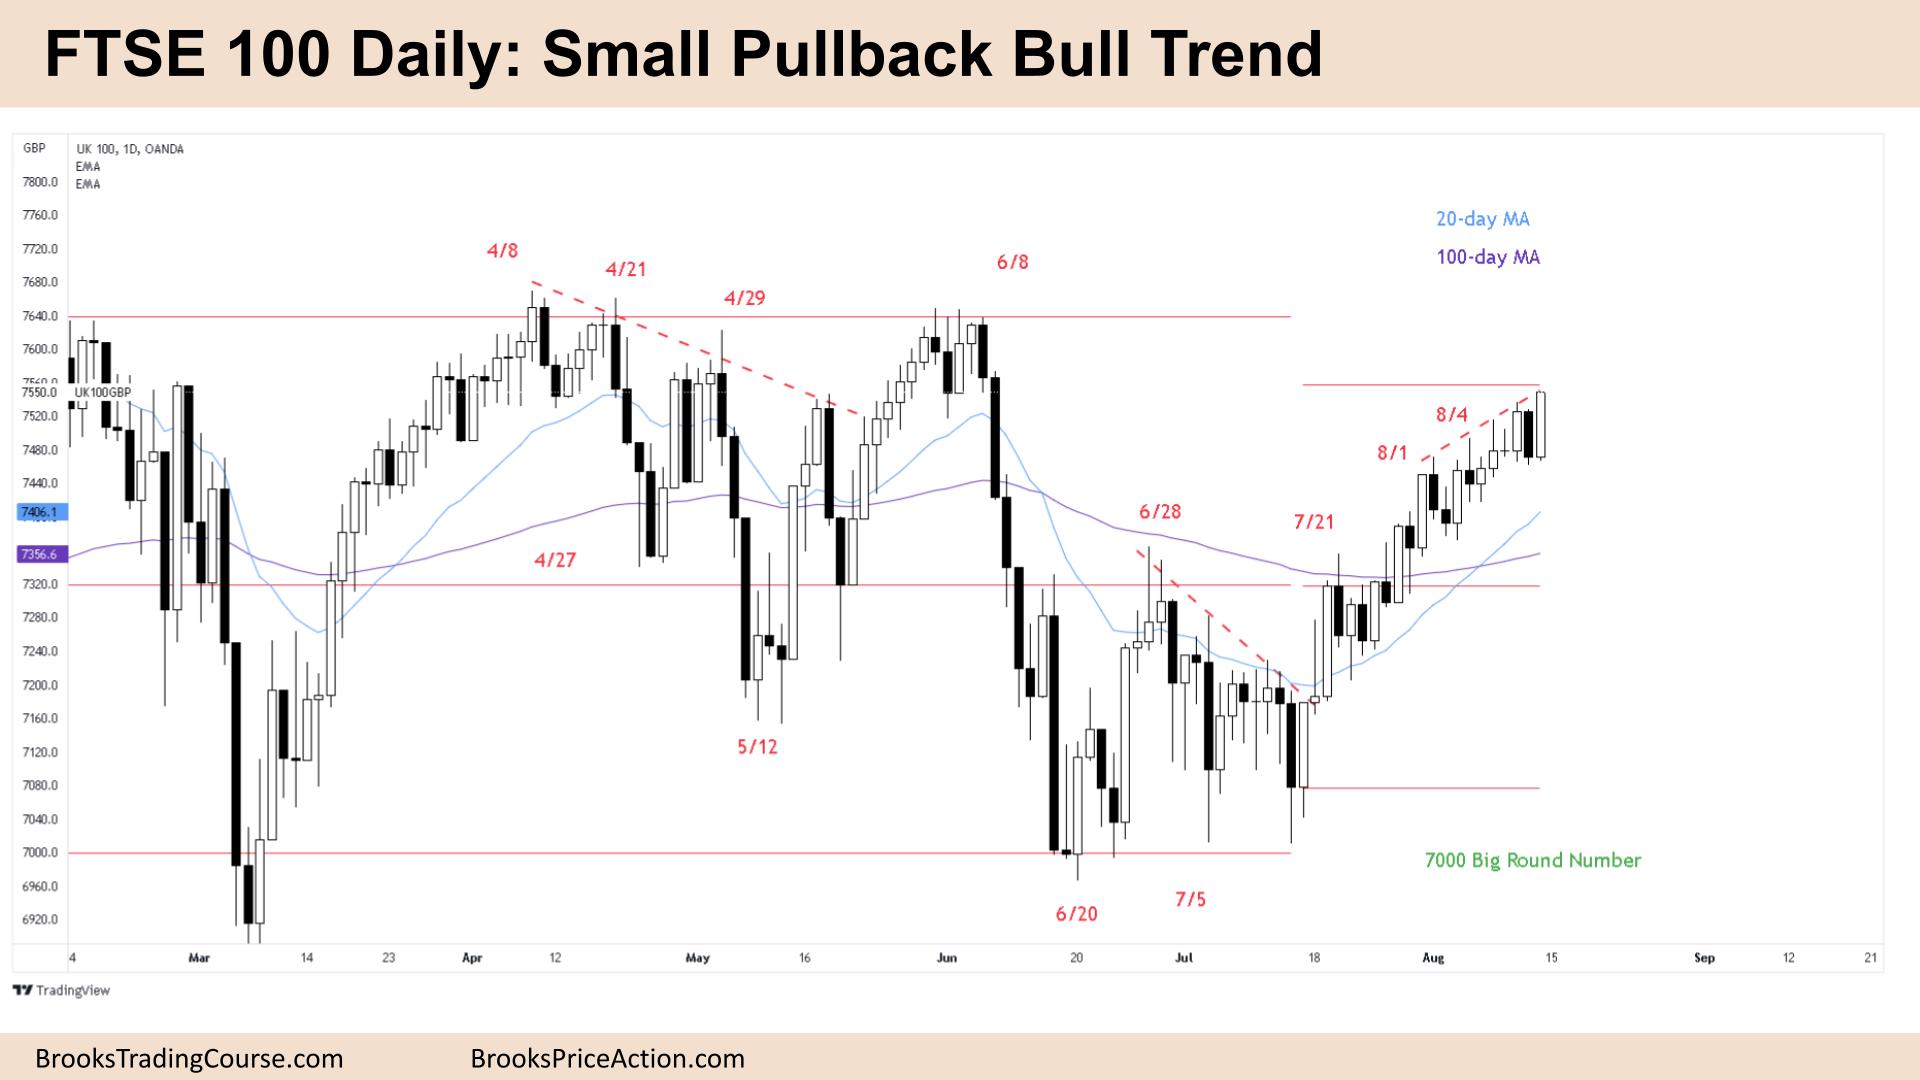
FTSE 100 tight bull channel and double top on the weekly chart. On the daily chart it’s a small pullback bull trend so traders should only be looking for buy setups. But we have been in a trading range for over a year, and it looks most bullish at the top of the range and most bearish at the bottom. The bulls want the upside breakout to an all time high, but have had trouble getting strong closes above this area. Bears will look to short again above this week betting on a failed breakout of the wedge on the daily.
FTSE 100 Futures
The Weekly FTSE chart

- The FTSE 100 futures was a bull bar closing on it’s high so we might gap up on Monday.
- For the bulls it’s an 8-bar bull channel. It’s also a 5-bar bull micro channel without a low going below a prior bar, so it’s a breakout on a higher timeframe (monthly.)
- Bulls want a breakout above the high of this range for a measured move up, but we have been going sideways here for over 12 months and 80% of breakouts fail.
- The bears see a deep pullback from the first leg of a lower high major trend reversal. Their case will stay valid as long as we get another lower high.
- Bears see a potential double top with May 23rd. They know the risk is too large for bulls without them starting to take profit.
- The bears expected a trading range after such a long bull trend and are looking to sell as the math favors short-side.
- But the signal is bad — a tight bull channel. The bears need a Low 1 or Low 2, a decent sell signal to enter. So entering around here is low-probability but limit-bears will scale in above bars.
- If you look left, it looks most bullish near the top of the range and most bearish near the bottom. This is one of the hallmarks of a trading range.
- Assuming we gap up next week on Monday, bears will start to sell above this week looking to create a tail to short around.
- After so many bull bars the first bar to go below a prior low will be typically bought as a pullback, so short-side traders should look for a second entry.
- Targets — the buy signal on May 23rd — we might need to get above to let bulls out.
- There is a still a gap at 7360 which could be the measuring gap for a measured move which would put the upside target above the all time highs.
The Daily FTSE chart

- The FTSE 100 futures was a large bull bar closing on it’s highs so we might gap up on Monday.
- The bulls see a 20-bar small pullback bull trend close to a measured move target. They also see a wedge but small pullback bull trends are constantly making wedges.
- It’s a tight bull channel so traders will expect a pullback, likely two legs back to the moving average (MA.)
- because it’s been more than 20 bars above the moving average it is climactic and unsustainable so profit taking might be starting soon.
- Friday’s bull bar is one of the largest in the trend and that can often indicate profit-taking and exhaustion rather than a further breakout. Traders will look to take the opposite side underneath these bars, betting on failure.
- Having said that, trends go often go much further than anyone expects, so we’re always in long so only buy.
- The bears see a spike down from June and now a slow pullback to the breakout point. They saw the failed Low 2 sell on Thursday and will look to sell again below a strong bear bar.
- Most traders should wait for consecutive bear bars before shorting and instead only buy in a small pullback bull trend.
- The bears want a failed breakout above this wedge and two legs down, knowing the first touch of the moving average will likely be bought.
- If you’re long, stop below Thursday.
Market analysis reports archive
You can access all weekend reports on the Market Analysis page.

