Market Overview: FTSE 100 Futures
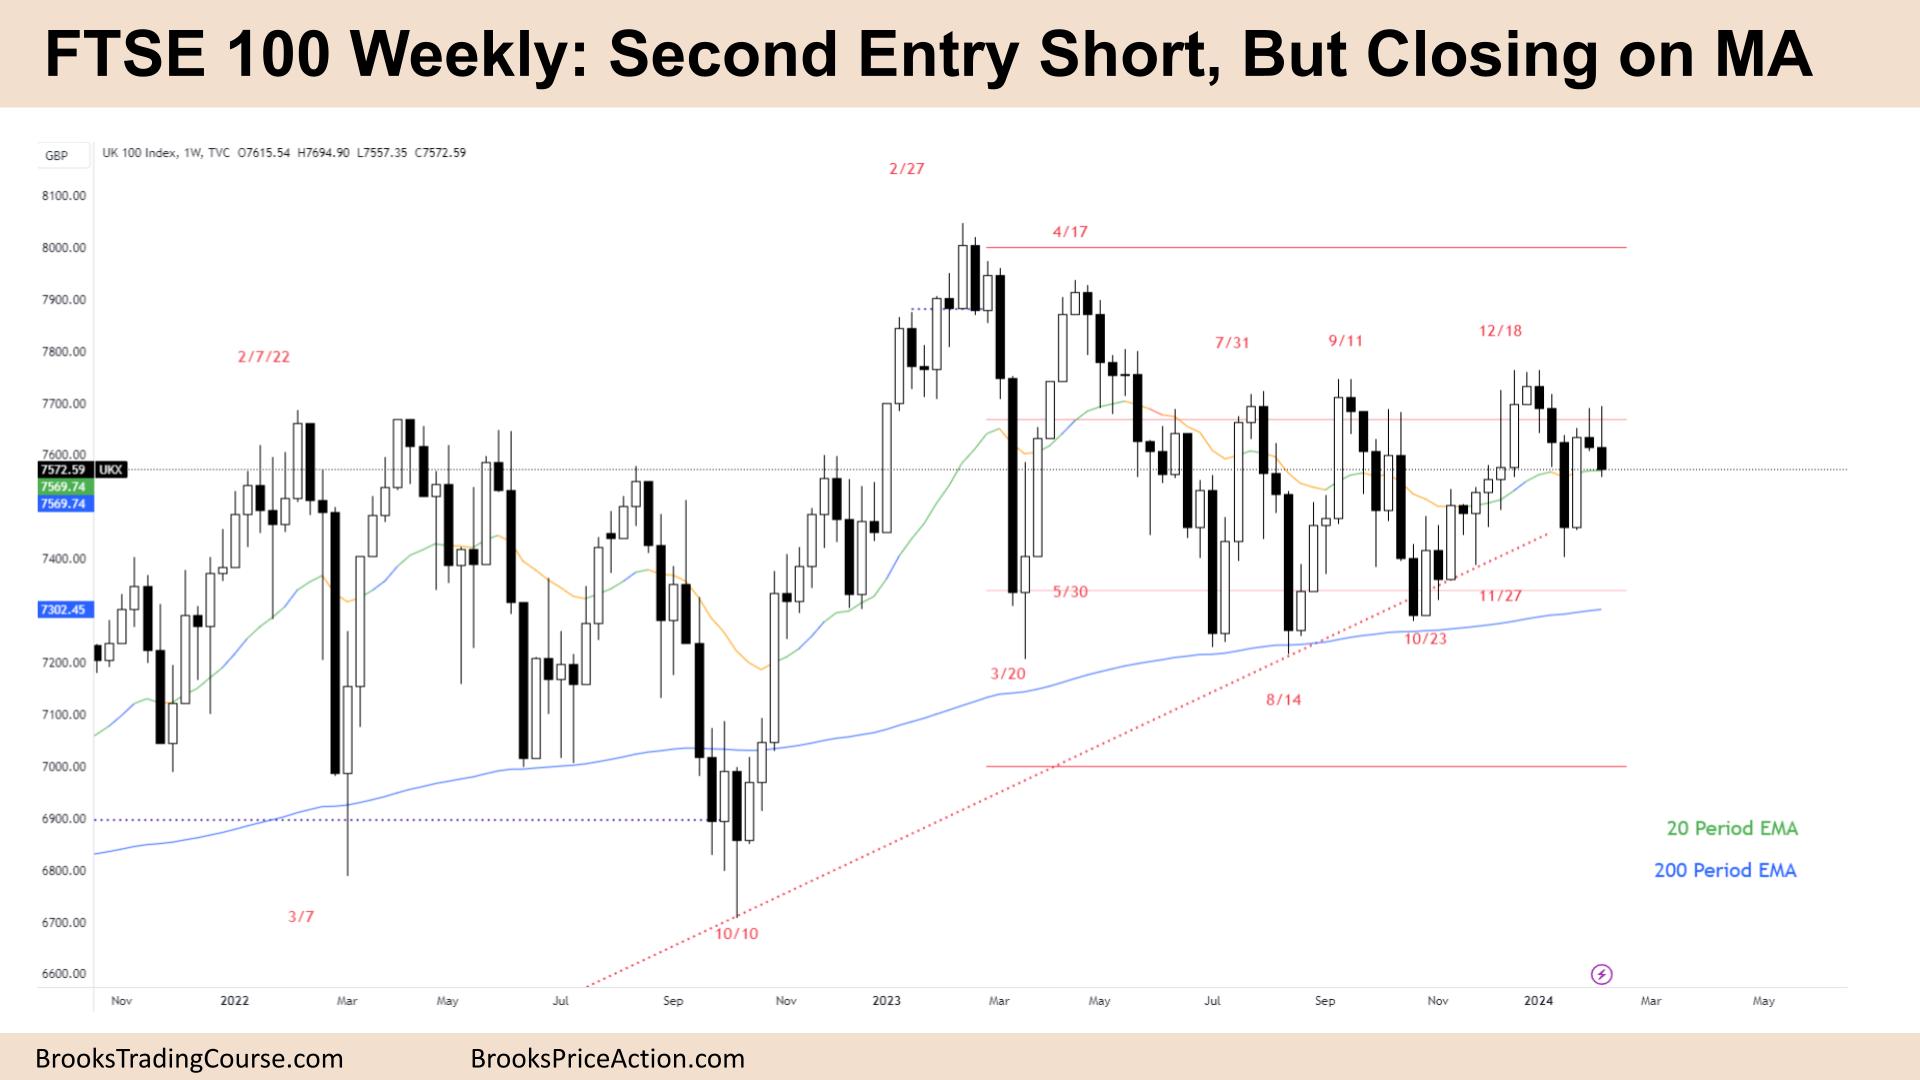
FTSE 100 futures moved lower last week with a bear outside down bar, a second entry short in a trading range. It’s a broad bull channel, and so bulls and bears can make money. Neither side is trapped yet, so we are sitting between 7000 and 8000. I prefer to be flat right now; I think there is a 60% chance the bulls will get a breakout. I am looking to buy lower if I can or wait for a BO.
FTSE 100 Futures
The Weekly FTSE chart

- The FTSE 100 futures moved lower last week with a bear outside down bar, a second entry short in a trading range.
- The bulls see an HTF trend line, a broad bull channel and a breakout test of a triangle.
- The bears see a DT or triple-top wedge bear flag after an ATH.
- The bulls want consecutive bull bars above the MA.
- But they got consecutive bear bars. Disappointing.
- The bears wanted a close below the MA. But it closed at the MA. Disappointing.
- If everyone is disappointed, we are in a TR, and traders should BLSHS take quick profits.
- It is an outside down bar, a lower probability short entry for stop order traders.
- The bears need one more bar below the MA to keep it always-in-short. They will likely not get it. If they can setup another signal after the second entry that would be even higher probability.
- Always in long, traders would have exited a few weeks ago. Some traders would sell the 2 bear bars before.
- Trading ranges have deep pullbacks, so low in a TR is a good place to start buying. But I think limit order bulls are waiting for tails or a sign of sideways first.
- There were going to sellers above the highs of those bear bars to the left. Bear microchannel setup reasonable short entries above the bars in the right context.
- They might be targeting the lows, scalpers would usually target the MA for a quick trade.
- Outside bar, so follow-through is important, especially below the MA, to see if the bears can get a new low.
- Expect sideways to down next week.
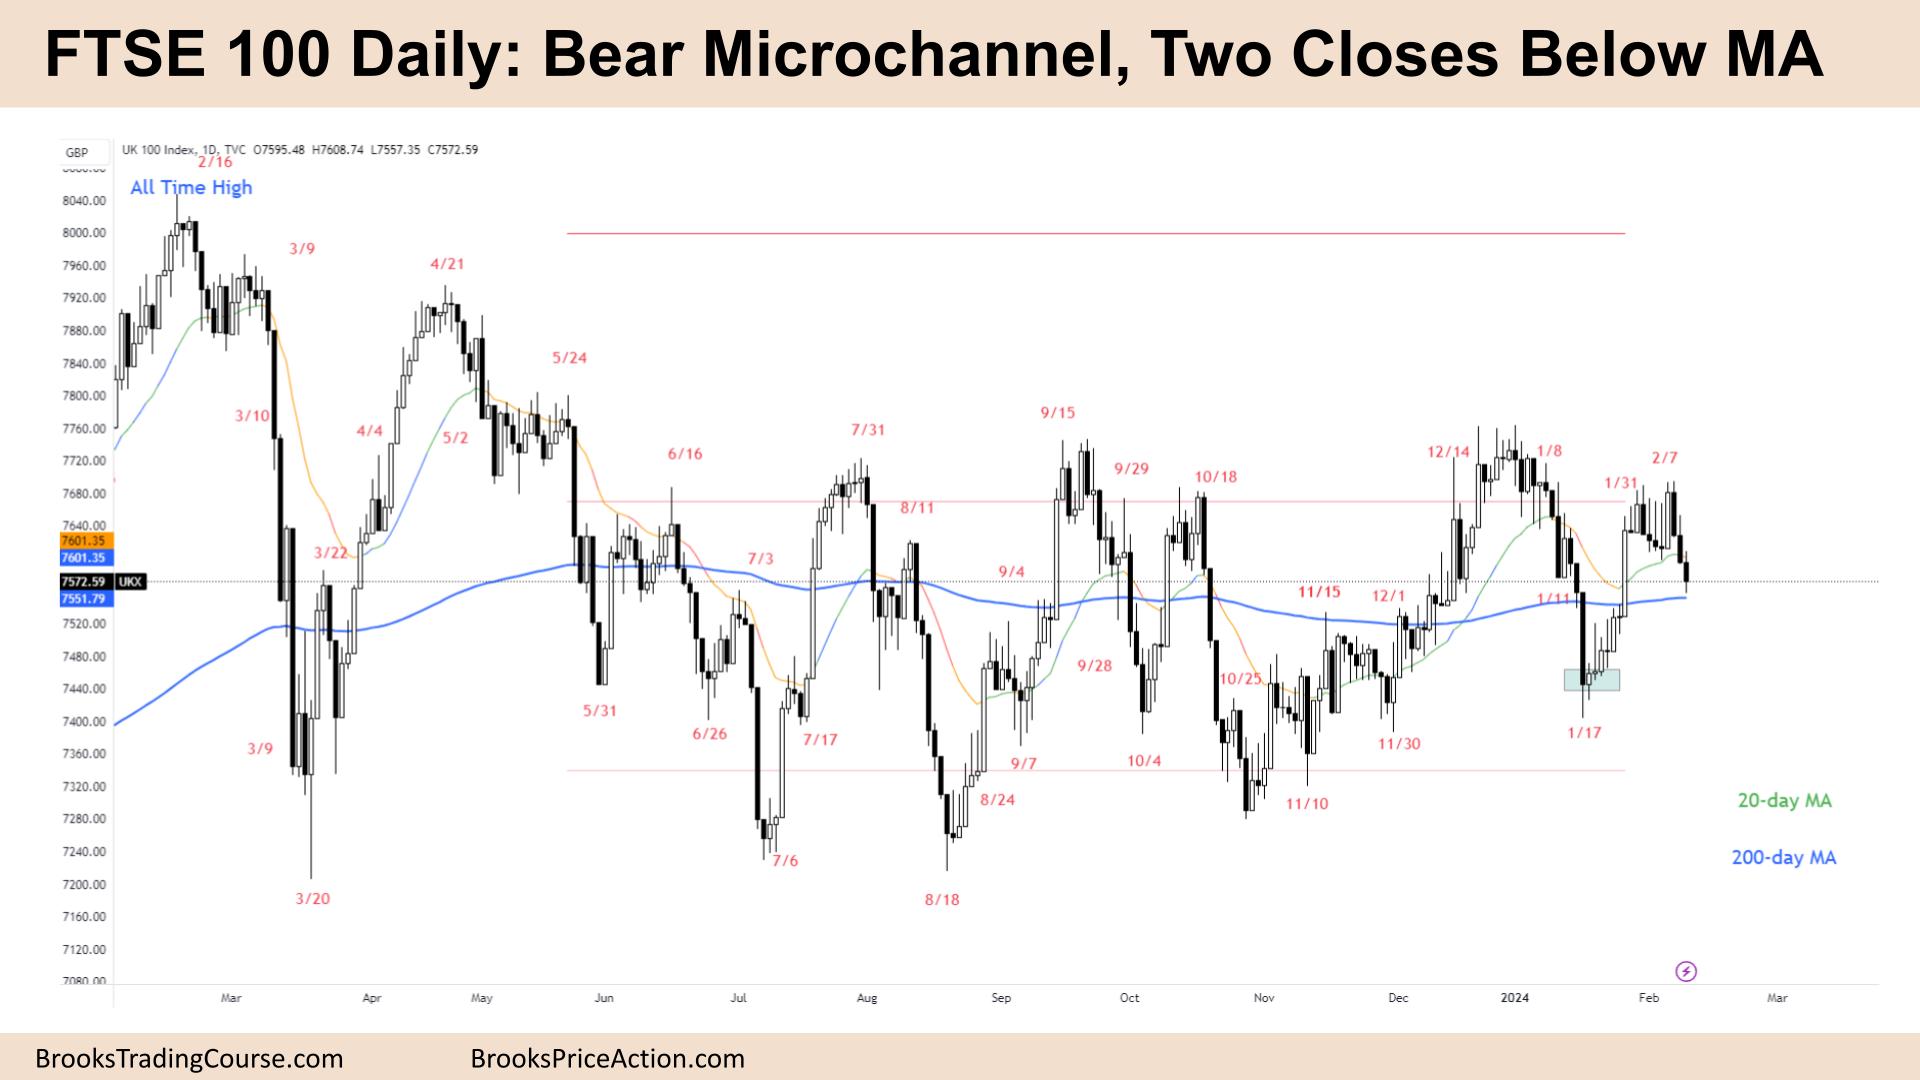
The Daily FTSE chart

- The FTSE 100 futures moved lower last week with three consecutive bear bars, a bear microchannel closing below the MA.
- The bulls see a bull spike and a pullback, a Low 2, which they hope will fail and set up a High 2 above the MA.
- The bears see a LH DT, another DT bear flag and a strong move down to get a new low.
- But neither trader convincingly took out another swing point. Some bears may have been short since December. And bulls have been long since August 2023, November 2023 or January 2024.
- This can only happen in a triangle, which is often BOM.
- The bulls wanted a break above the DT, but we went down.
- Bears wanted a strong close below the prior sell climax high in January.
- Both are disappointed.
- Always in long traders would have exited a few weeks ago. Some traders would sell the 2 bear bars before.
- I didn’t take the trade because it is close to the MA. Even though it was a second entry short trade.
- The bulls want this to be a second-leg trap. A type of spike and climax where the second leg is much bigger than the first.
- Three bars in a row, so some traders will wonder if the bears get another leg down. It might be a pause bar on Monday and then one more bar on Tuesday.
- Tuesday last week had a bull breakout and then three days of bear breakouts – that usually traps traders under Tuesday. We may have let them out on Friday. Otherwise, Monday should get them out.
- Expect sideways to down next week.
Market analysis reports archive
You can access all weekend reports on the Market Analysis page.

