Monthly S&P500 Emini futures candlestick chart: Pullback in bull trend
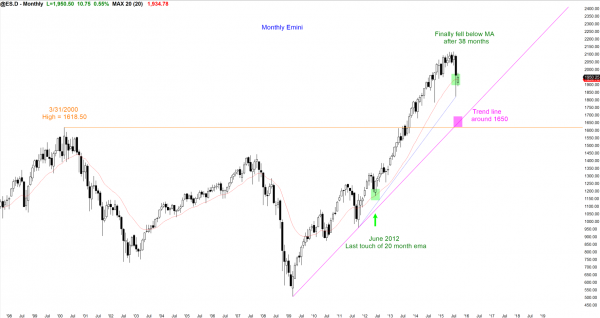
The monthly S&P500 Emini futures candlestick chart is holding support at the 20 month moving average
The monthly S&P500 Emini futures candlestick chart finally pulled back to its moving average after 38 months above the average. It found buyers there. Since 38 months is extreme, the bull trend is a type of buy climax. A buy climax is usually followed by at least 5 – 10 bars of sideways to down price action before the bulls will buy again. This means that the current pullback is a bull flag, but the flag might grow and last possibly a year before the bull trend resumes.
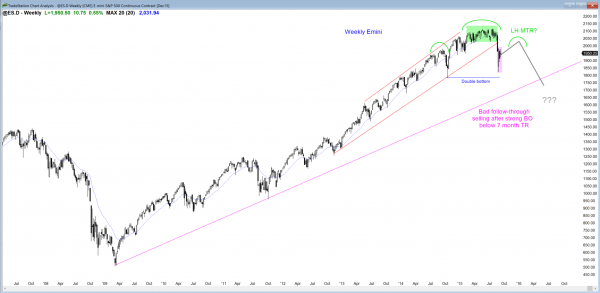
Weekly S&P500 Emini futures candlestick chart: Double bottom, but head and shoulders top likely
The weekly S&P500 Emini futures candlestick chart has been sideways for 3 weeks after a huge bear break below the bull channel. The follow-through selling has been bad for the bears and there is a 50% chance of a rally before the 2nd leg down begins. If there is a rally, the odds are that it will form a right shoulder of a head and shoulders top and it will be followed by a 2nd leg down.
The weekly S&P500 Emini futures candlestick chart had a strong bear break below a bull channel. The odds are that the bear breakout will have at least one more leg down. This means that whatever additional sideways to up bars that form on the candlestick chart will probably form a right shoulder of a head and shoulders top. This lower high major trend reversal has a 40% chance of a swing down on the weekly chart, but at least a 60% chance of a leg down within the trading range.
Every head and shoulders pattern is a trading range, and only about 40% of the good looking candlestick patterns are followed by a strong breakout and measured move. More likely, the trading range continues. If there is a bear breakout, the odds are that it will not go far. However, there is a 40% chance that the breakout will fall for a measured move down. Since the trading range is 300 point tall, if the measured move is based on the height of the trading range, the Emini might fall to 1500. This is unlikely because of the bull trend on the monthly chart.
More likely, the measured move will be a leg 1 = leg 2 measured move down. Leg 1 was about 300 points and it ended with the selloff 2 weeks ago. Although leg 2 might have started with this week’s micro double top, the odds are that the pullback from leg 1 will last for more bars (weeks), and it has a 50% chance of testing up to the bottom of the 7 month trading range. That is around 2050. If leg 2 then began there and it was also 300 points, like leg 1, the bottom of the selloff would be around 1750, which is just below the October low. That is a more likely outcome, and it has about a 50% chance of occurring, based on the price action at the moment.
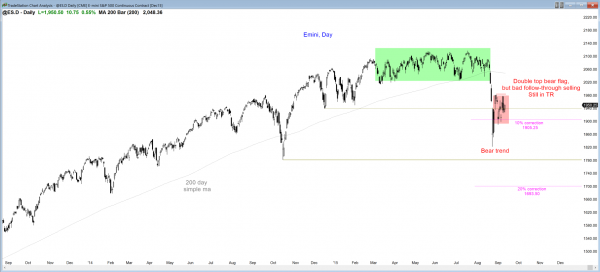
Daily S&P500 Emini futures candlestick chart: Traders learning how to trade the markets see a pullback in bear trend
The daily S&P500 Emini futures candlestick chart had bad follow-through selling after turning down from a double top bear flag this week, and there is a 50% chance of a breakout above the bear flag before the bear trend resumes.
The daily S&P500 Emini futures candlestick chart is in a tight trading range after a huge bear breakout. It is in a bear trend and there is a 60% chance of a 2nd leg down. What is unclear is whether the 2nd leg down began with this week’s double top bear flag, or if the bear flag will break above this week’s double top bear flag and end at the bottom of the 7 month trading range at around 2050. Each possibility has about a 50% chance.
There is a 40% chance that the bull trend on the monthly chart is so strong that it is already in the process of resuming, and that the bear trend on the daily chart ended with the low 3 weeks ago. Most traders will not believe this until the Emini gets back up to a new all time high. Alternatively, traders will conclude that the bulls had taken control before going above the all-time high if the trading range grows to 20 – 30 or more bars and forms a strong bull candlestick pattern followed by a strong bull breakout of the pattern (but not yet a breakout of the all-time high).
Traders can see the end of the day bar-by-bar price action report by signing up for free at BrooksPriceAction.com. I talk about the detailed Emini price action real-time throughout the day in the BrooksPriceAction.com trading room, and a 2 day free trial is available.
When I mention time, it is USA Pacific Standard Time (the Emini day session opens at 6:30 am PST, and closes at 1:15 pm PST). You can read background information on the intraday market reports on the Intraday Market Update page.


Hi Al,
I often hear that beginners don’t have the account size to risk 3-4 points on the ES for a swing trade, and I remember a few occasions you said it is ok to miss those trades.
Would you recommend beginners to take the same trade on YM or NQ, since the tick size is lower than ES. Also the correlation closely tracks the ES with coefficient 0.9 -0.8 most of the time.
If a trade needs 4 pts risk initially, and the setup and context are reasonable, I believe it is ok for a beginner to take the trade if his account size is big enough. What is big enough? I think it is hard to begin trading without at least a $5,000 account, and it is much better if a trader had a $25,000 account. If he has a $5,000 account, then he should consider the NQ. I have tested the YM every few years to see if slippage is still a problem. I have not tested it in a few years, and it still was a problem at that time.
I also think that there is nothing wrong with missing trades. I see at least 50 trades a day in the Emini and another 50 in other mkts, but don’t take most of them.
If a trader as a big enough account to day trade stocks, then VXX and XIV are good choices, as is the SPY and QQQ. These allow a trader to trade with less risk, and this reduces the emotions. This helps a trader to be more objective, which is critical.
Hi Al,
What are your thoughts on the weekly chart of the Euro? I see a triangle, which may have a failed bear breakout below and form a final flag reversal buy.
https://www.tradingview.com/x/84wPJUvW/
When a mkt is in a TTR like that, there is usually a way to construct a triangle. When the triangle is clear, I use the term. Otherwise I simply call it a tight trading range (TTR) and say that it is in breakout mode.
It did have a bear breakout that reversed up and then a bull breakout that is trying to reverse down, but until there is a clear breakout with follow-through, there is no breakout and it is still in breakout mode.
The Fed announcement of Wednesday has the potential to create a breakout up or down in all financial mkts, but trading ranges have a strong ability to resist breakouts, and even the Fed announcement could lead to a breakout that fails.
Hi Al,
I only have time to read your analysis in detail over the weekend. I very much enjoy your market insight and it nicely prepared me when the breakout occurred. My favorite instrument is the Vanguard Index ETF VOO that I trade on the 30 minute time frame. After noticing three pushes down between 8/24 – 8/26 I bought 500 shares during the reversal with a limit order at 174 and sold a day later at 182. This pays for my trip to visit my daughter in Berkeley later this year.
That is great! I think you should consider higher volume markets, like QQQ or SPY because slippage will be less, which should slightly increase profitability.
By the way, 2 of my daughters and one of my stepsons went to Berkeley (one then went to U Mich Law School, another to Harvard Business School; the 3rd is still at Cal). It is a very special place and you should be very proud of her.
Hi Al,
During the initial bear breakout from the 7 month trading range do you mind me asking if you day traded during or did you place a swing trade.
During the last couple sessions I was watching the 4 hr trend line to see if it was going to be broken or not. I placed a test trade at its initial break but surprisingly price kept moving back above it. It was breached 3 times without follow through. This tells me there is intermediate buying pressure. I would expect higher prices this week without some kind of macro intervention. It would be nice to see a test and failure of the underside of the 7 month trading range as you stated.
May I ask … During a higher low or lower low reversal what are traders thinking that causes one to form over the other.
I’m interested in the psychology behind each one.
Thanks very much for any input.
I don’t remember what I did today, never mind weeks ago, but I am always trading. When days have big ranges, they have high probability trades, which are my favorite, and those days are usually my most profitable. Yes, I traded, but when ranges are big, scalps are 4 pts and swings begin at 10 pts. I don’t remember how many of each I took, but I usually take more scalps.
As for HL and LL bottoms, the forces are the same and either can be a sign of stronger bulls. Some lower lows are from extreme sell climaxes and lead to big reversals. Some higher low bottoms can also have a violent reversal as the last bear gives up, and the bulls waiting for confirmation of the bottoms suddenly become very eager once they believe the bears are giving up. I could write an hour about this, and will talk more about it in the upcoming revision of the course.