Monthly S&P500 Emini futures candlestick chart: Candlestick pattern will be clearer next week
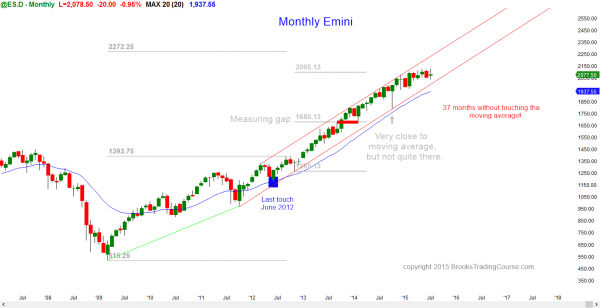
The monthly S&P500 Emini futures candlestick chart is in the middle of its 5 month trading range, and the candlestick pattern today is a doji. The chart is in breakout mode.
The monthly S&P500 Emini futures candlestick chart has been above its moving average for 37 months, which has happened only twice before in the past 50 years, Since the moving average is about 10% down from the high, there is about an 80% chance of at least a 10% pullback this year. The current candlestick pattern in a doji, but the month has one week left and it can be a strong bull or bear bar once it closes next Friday. The context is a tight trading range, which is a breakout mode candlestick pattern. This type of price action is usually followed by a breakout. Since the monthly chart is so overbought, a bull breakout will probably fail within a few months and then reverse down.
The bear reversal will probably just become a pullback on the monthly chart, which means that there will probably be bulls willing to buy once it falls to the moving average. However, the selloff will be enough to create at least a brief bear trend on the daily chart.
Weekly S&P500 Emini futures candlestick chart: Another reversal in a 6 month tight trading range
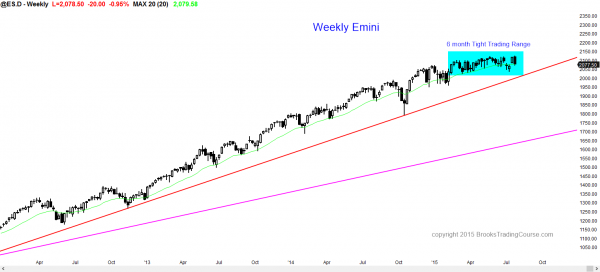
The weekly S&P500 Emini futures candlestick chart reversed down from a new all-time high, but the price action is still within a 6 month trading range.
The weekly S&P500 Emini futures candlestick chart gapped up last week, creating an island bottom, but this week’s reversal down closed the gap up, and the tight trading range is still in effect. Until there is a strong breakout with good follow-through, there is no breakout. Even though this week’s price action was bearish, the selloff is still simply a pullback to the weekly moving average. This week was likely to disappoint last week’s bulls because that is one of the hallmark’s of a trading range. Strong bars are more likely to reverse than begin a breakout.
Daily S&P500 Emini futures candlestick chart: Strong reversal down from a weak breakout to a new all-time high
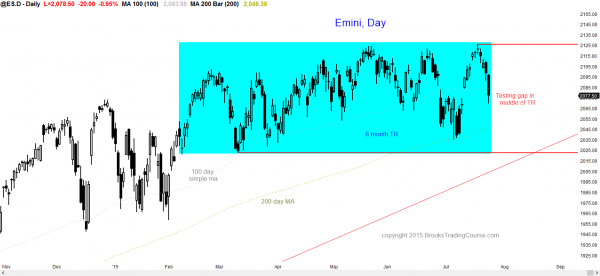
The daily S&P500 Emini futures candlestick chart sold off strongly from a new all-time high and it is now testing the middle off the 6 month trading range.
The daily S&P500 Emini futures candlestick chart reversed down strongly from a new all-time high. I mentioned that there might be a pullback to test the gap and the top of the trading range from 2 week’s ago, but this week’s selloff was surprisingly strong. Does that make it likely to be the start of the bear breakout? No more so than last week’s rally was likely to be the start of a successful bull breakout. When the price action is within a trading range, the probability of the direction of a successful breakout is about equal for the bulls and bears. The bears have a slight advantage because of the current buy climax on the monthly chart, but until there is a strong breakout, the probability is not much more than 50% for either the bulls or the bears.
This week’s selloff was climactic and it will probably be followed by at least a couple of day’s up next week. If instead next week continues to sell off with big bear trend bars, the odds of a bear breakout will go up. If the bears succeed in getting a strong breakout below the trading range, traders will expect at least 2 legs and a measured move down. Since the trading range is about 100 points tall, the selloff will probably be at least 100 points, and test the monthly moving average. The swings have been stronger and the reversals bigger over the past month. This increases the chances that there will be a breakout soon.
Traders can see the end of the day bar-by-bar price action report by signing up for free at BrooksPriceAction.com. I talk about the detailed Emini price action real-time throughout the day in the BrooksPriceAction.com trading room, and a 2 day free trial is available.
When I mention time, it is USA Pacific Standard Time (the Emini day session opens at 6:30 am PST, and closes at 1:15 pm PST). You can read background information on the intraday market reports on the Intraday Market Update page.


very helpful comment Al.
A request: could you find an example of what you described and do a short review of the chart, illustrating how you are reading the PA as the move unfolds. e.g., signs the pb will not be a trading range, signs you notice that suggest the move will continue. It is that intra-trade read that is really hard to understand.
any info is helpful. thanks much.
Hi Al,
We have now had the retest, the sell side was fairly aggressive. The reason for this was that the professionals were in on it, they never take the first break down or up. That also was the lowest risk short entry, I did enter myself.
Now to see if the bottom of the trading range will hold. I doubt it.
The last time we’ve had a weekly candle like the current one was 48 months ago
and that led to a decline. The market is looking like it wants to roll over. The line in the sand will be the weekly trendline, if price effortlessly slices through that the bears will want to gather momentum. Now … should a new catalyst surface {news} then that will add fuel the the bears fire. Technically we have the beginning, now waiting for the confirmation.
I am less certain than you that this is the start of the 10 – 20% correction that is likely to come this year, although I am 80% certain that it will come, and the year is running out of time. I am still neutral on the monthly, weekly, and daily charts.
Since last week was an outside down week within a tight trading range, and the daily chart was climactic, next week might be an inside week. This would create an ioi setup, which is a breakout mode setup (sellers below, buyers above, both looking for a measured move). However, within a tight trading range, it is not very reliable. Since I am bearish, I think that a trade below would be good for the bears because it might then lead to a trade below the July low (July ends at the end of the week), which would trigger a monthly sell as well.
The monthly chart closes next week and it will be interesting to see if the bar closes on its low. It was a sell entry bar when it fell below June’s low, but then it traded above June’s high, theoretically trapping the bears out. If it closes back below June, and then August trades below July, that would be a 2nd entry sell in an extremely overbought market, and it would have a higher chance of success.
One of the difficult things about a rounded top is that the reversal is not clear until it has already gone at least half way to the target. I believe that a bear breakout and a rounded top is more likely to form than a final flag top (a failed bull breakout above the weekly tight trading range), which would allow a high sell entry. However, I have to trade what is in front of me and not worry about what I would have preferred to see.
Thank you ….
I’ll be watching 2065 area and it’s price action. It all depends on how price reacts in this area. Supportive or Capitulative.
Best trades are when the sentiment is canted one way or the other, atm it’s always in short. (On daily chart) You are correct on the theme of this observation, and that is we are not always in short on the weekly or monthly. But once this is confirmed some or even allot of the move is over.
We have just had a triple top and seasonally we could be in for a down move into Aug Sept. These are the factors I have mulled over together with where would be the lowest risk entry.
I will be flexible, in fact it’s a necessity.
Hi Al,
I have your three books on Trading price action and your video series. I have struggled to find consistency over the past 2 years but one thing you have said is it takes time and you have to find what matches your personality. I personally hate to lose and one thing you mentioned was breakouts tend have the highest odds although it does take some getting used to. I have been trading very small size but results have been coming nicely. I wanted to ask about breakouts in particular. I have been looking at biggest S&P 500 movers during the first few minutes of the open to find large gap ups and gap downs. On the bull side, I have looked for upward breakouts followed by 2-3 good size bull trend bars. I also try to look at a bigger time frame to make sure I am not buying where some major resistance area would be. I have noticed that is the first 2-3 bars on an upside breakout are good bear trend bars, that a bearish bet also seems to work well. My problem has been where to take off the trade. In the bullish case, where we open with 3 strong bull bars, I try to use the size of the spike to get a measured move target. Sometimes this works and sometimes it doesnt. Also, when I see a MTR forming I take it off and it seems inevitably the pattern fails and I should have held onto it. Any tips for trading these types of breakouts in terms of targets and how to trail your stop?
thank you very kindly,
Luke
As you know, I like breakouts, but as you also know, they are often vacuum tests of support or resistance. The most reliable breakouts consist of trend bars that are not too big. When the bars are much bigger than the other bars on the chart, the chance of a climax and a trading range or a reversal can get close to 50%.
With any breakout, I try to decide if the breakout has ended. Where is the market in the market cycle? If it has ended, I then need to know if there is now an endless pullback that can lead to an opposite breakout, or if there is a 5 – 10 bar pullback that will lead to a resumption of the trend (usually in a channel). If the pullback grows to more than 20 bars, I then trade it like a trading range, buying low, selling high, and scalping.
As long as I believe that the odds are that any PB will be brief, I am willing to swing at least part. If I instead believe that the market has transitioned into a trading range, I stop swing trading and begin scalping. If I am swing trading, I look for measured move projections, trend lines, and other support and resistance to take profits, and my minimum target for taking profits is at 1x actual risk for a high probability trade and 2x for a lower probability trade.