The monthly S&P500 Emini candle chart is in a strong bull trend but overbought

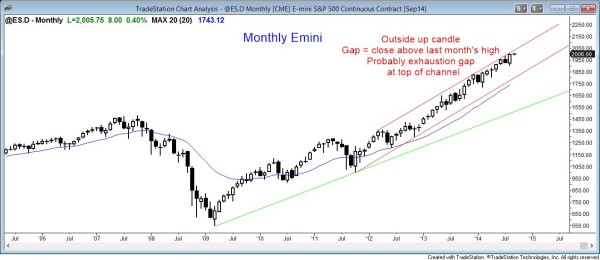
The S&P500 Emini monthly chart is in a strong bull trend, although it is overbought.
I have talked about three signs that the monthly chart is overbought. Only twice in the past 20 years has the S&P500 Emini been above the moving average for this many bars and for this many points, and each prior time it reversed about 20%. However, it can stay overbought for a much longer time than what seems reasonable. The third sign is that a bull trend on the monthly chart rarely goes this long without a 10% correction. However, there is no sign of a top. Also, it is in a small pullback bull trend, which is the strongest type of trend. The first reversal will probably be limited to only a few bars, which is a few months. The pullback might be twice the size of an average bar. This could be 100 – 200 points on the monthly chart, which would be a small pullback. However,it would be a scary selloff on the daily chart.
For a big correction or reversal to occur, the monthly chart would either need a fast, big bear breakout of 200 or more points, or an increase in selling pressure that then creates a topping pattern. For example, if the bars enter a trading range for 5 – 10 bars, a double top might form. Until there is more selling pressure, the bears will probably be limited to creating a small pullback, which would be a bull flag.

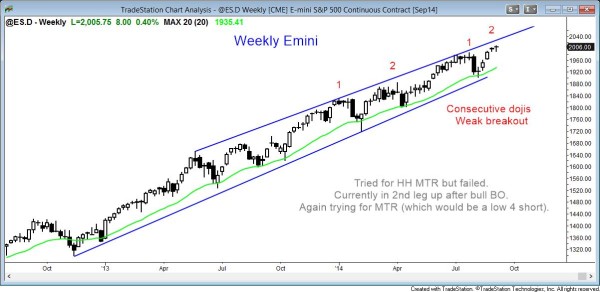
The S&P500 weekly chart is in a strong bull trend, but it is at the top of the channel and it will probably soon evolve into a trading range.
The weekly Emini chart is having a second attempt at forming a higher high. The attempt in April failed. The market broke out and is now in a second leg up. This is creating another possible higher high major trend reversal. Since the channel is tight, the downside will probably be limited to the formation of a trading range. Channels are usually followed by trading ranges, not opposite trends. The trading range can then create a topping pattern, but is has an equal chance of a bull breakout and then the resumption of the bull trend.
The Emini has had two dojis on the breakout above the July high. This is not how a strong breakout typically looks, and it increases the chances that the breakout might fail. The Emini is also near the top of the channel. However, there is no top yet, and there is room to the trend channel line above. The market might have to go a little higher before there is a 5 – 10% pullback.

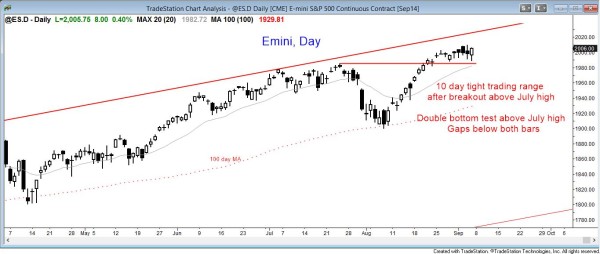
The S&P500 daily chart is in a 10 bar tight trading range, just above the July high.
The daily chart is interesting. It has been in a 10 bar tight trading range since breaking above the July high. This is not how strong bull breakouts typically look. However, today and last Thursday both tried to close the gap above the July high, but the Emini reversed up. This is a sign of strong bulls and it might lead to a bull breakout and a measured move up, which probably would hit the top of the channel.
Sometimes, however, a tight trading range forms after a strong rally, and then there is a small double top within the trading range. This can be a small double top, lower high major trend reversal. When that happens, it could lead to a two-legged reversal. Since 10 bars is not much on the daily chart, given how long the bul ltrend has been in effect, the pullback might instead be about 10 or more bars on the weekly chart. Bulls will watch for the reversal. The probability of a profitable short is low until there is a strong bear breakout. At that point, the stop is farther away and there is less profit remaining, but that is the trade-off that traders make when they want higher probability.
Traders can see the end of the day bar-by-bar price action report by signing up for free at BrooksPriceAction.com. I talk about the detailed Emini price action real-time throughout the day in the BrooksPriceAction.com trading room, and a 2 day free trial is available.
When I mention time, it is USA Pacific Standard Time (the Emini day session opens at 6:30 am PST, and closes at 1:15 pm PST). You can read background information on the intraday market reports on the Intraday Market Update page.

