Monthly S&P500 Emini candle chart: breaking above top of bull trend channel

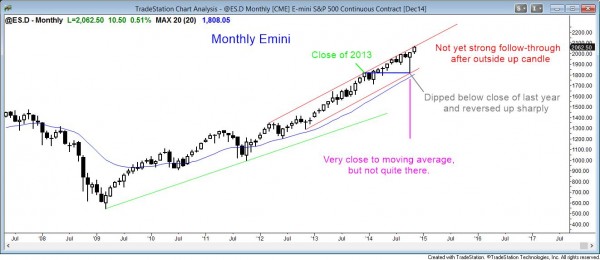
The monthly S&P500 Emini chart is in a strong bull trend and it is breaking above the top of the bull trend channel.
The monthly Emin chart is in a strong bull trend, but it is overbought and likely to enter a trading range soon. The breakout bar so far is not yet big and it is too early to know how strong the breakout will be once the candle closes. Because the chart is so overbought, there is a risk that the Emini can turn down on any candle and create a top of a trading range. However, until it does, the bulls are still in control and the trend up can continue a long time, despite being overbought.
This is a bullish time of the year, and there is a strong tendency for the market to close on December 5th above the close of November 11. The Emini is well above that target. Even if it sold off over the remainder of this bull window, it could still be above that price, and this would be just another example of the December 5 close being above the November 11 close, despite the weakness. The point is that the Emini is currently in an especially strong window.
Weekly S&P500 Emini candle chart: closed above top of weekly trend channel

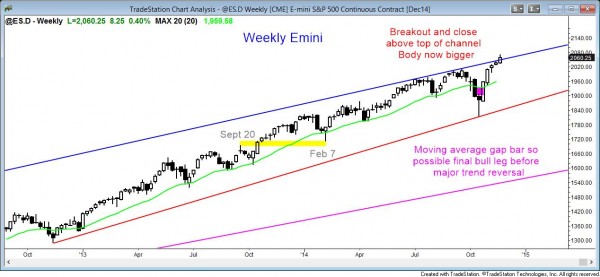
The weekly S&P500 Emini chart broke above and closed above the top of the trend channel, and the body is bigger than those of the past 2 weeks.
The weekly Emini chart is in a strong bull trend. It closed above the top of the bull trend channel, but today’s selloff put a tail on the top of the bar. The bodies have been shrinking over the past 4 weeks, which is a sign of a loss of momentum. However, the body this week increased in size and therefore showed renewed strength by the bulls.
Bull breakouts need follow-through in the form of additional consecutive bull bodies to make traders believe that the odds are good that the bull trend will continue. If next week is a strong bull trend bar, traders will consider the possibility that this bull breakout above the bull channel will be successful, like the one that occurred on the monthly chart after the republicans took control of the House in 1994.
It is more likely that this bull breakout will be like most breakouts above bull channels, which means that it will probably fail within 5 bars. This is a weekly chart, so the breakout might hold for another month before it finally fails. If it instead creates a series of bull candles closing near their highs, then the bulls might win and this could become an extremely strong bull trend.
If next week instead is a strong bear reversal bar, traders will begin to think that this week’s breakout will fail and that an expanding triangle top might trigger. However, the rally from the October low has been so strong that the first reversal down will likely not succeed. The bears will need either a strong bear breakout or a second signal before traders will believe that the bull breakout has failed.
Daily S&P500 Emini candle chart: gap up to new all-time high, but sold off all day

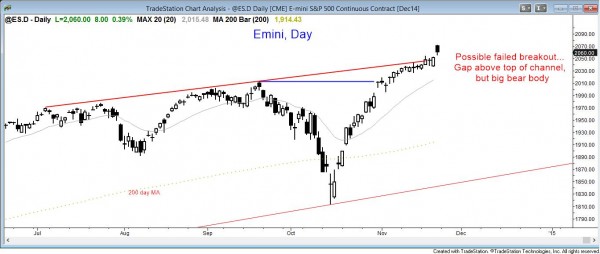
The daily S&P500 Emini chart gapped up above the top of the bull trend channel, but sold off all day. However, the low of the day held above the previous all-time high. An exhaustion gap is more likely than a measuring gap.
The daily Emini today gapped above the all-time high and above the top of the bull channel, and its low held above that all-time high. However, the Emini sold off all day. The bulls want this gap to become a measuring gap. If it does, the Emini might rally for a measured move up from the October low, which would be another 200 points from here.
The bears see the bear close and want today’s gap to close. It might do so in the form of a gap down at some point next week. This would create an island top, which could be followed by a move down to the bottom of the channel. The bears were able to reverse the Emini down after the September breakout and they are hoping to do the same here. If they succeed, they would create an expanding triangle top. When the market turns down from an expanding triangle top, it often falls below the bottom of the triangle (which is the October low), and then forms an expanding triangle bull flag. What usually follows is a big trading range. Any triangle is already a trading range, and this would just add more bars to that range.
If the Emini does reverse down, it might reach below the October low. However, if the reversal down is weak, it could drift down for a few months and reach the bottom of the channel without going below the October low. The bull trend line is rising. If the selloff is slow, the pullback could reach the line after the line has already reached the middle of the leg up from the October low. Since there are always buyers once a pullback reaches the middle of the last leg up, the bulls would be even more aggressive if that corresponded with a test of the bull trend line.
Traders can see the end of the day bar-by-bar price action report by signing up for free at BrooksPriceAction.com. I talk about the detailed Emini price action real-time throughout the day in the BrooksPriceAction.com trading room, and a 2 day free trial is available.
When I mention time, it is USA Pacific Standard Time (the Emini day session opens at 6:30 am PST, and closes at 1:15 pm PST). You can read background information on the intraday market reports on the Intraday Market Update page.

