Monthly S&P500 Emini futures candlestick chart: 80% chance of 10% pullback this year
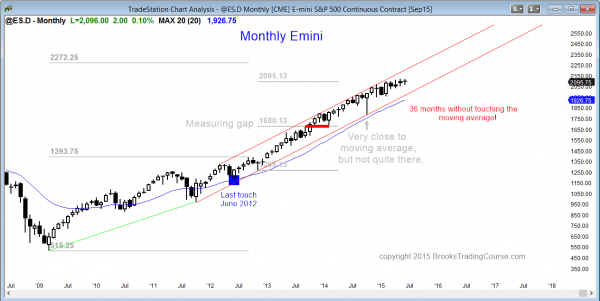
The monthly S&P500 Emini futures candlestick chart is extremely overbought, but there is no sign of a top. This month’s candlestick closes on Tuesday, and it might be a bear inside bar and therefore a sell signal bar.
The monthly S&P500 Emini futures candlestick chart is extremely overbought. This coming Wednesday is the start of the 37th month without touching the moving average. The 1998 rally lasted 44 months before having a 22% correction. The 1987 rally lasted one more month than the current rally, and then the stock market crashed 36%.
I do not believe that the stock market will crash, but I do believe that there is an 80% chance of at least 10% correction in the 2nd half of this year, and a 50% chance of a test of the October low, which is about 20% below the high. Although the small pullback bull trend is strong and it can go on for many more bars (months), the odds are against it. The slope of the bull trend is getting flatter, which means that the steep bull trend is starting to flatten. This is usually how a correction begins. However, until it has clearly begun, the bulls are still in control.
Weekly S&P500 Emini futures candlestick chart: Breakout mode
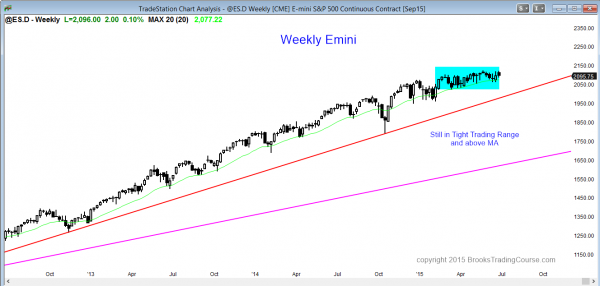
The weekly S&P500 Emini futures candlestick chart is in a 6 month tight trading range, but still above the moving average. The probability of a bull breakout is the same as for a bear breakout, but the bull breakout will probably fail.
The weekly S&P500 Emini futures candlestick chart is still in its 6 month tight trading range. If it has a bull breakout, it will probably fail within about 5 bars (weeks), and the tight trading range will be the final bull flag in an extremely overbought bull trend.
If there is a bear breakout, it could be steep and fast if there is a news event (like Greece defaulting), or it can be an endless pullback in a bull trend where there is no strong bear breakout. Instead, this could be a gentle bear channel. It would at first appear to be a bull flag, but it would then just keep drifting down. After about 20 bars (weeks), traders would then begin to view it as a bear trend instead of a bull flag. Once that happens, there is often a bear breakout that becomes a measuring gap, and is followed by a stronger bear trend. The bear breakout is a sign that the bulls have given up and that the bears have become much more confident.
Daily S&P500 Emini futures candlestick chart: Price action trading strategy for bearish candlestick pattern
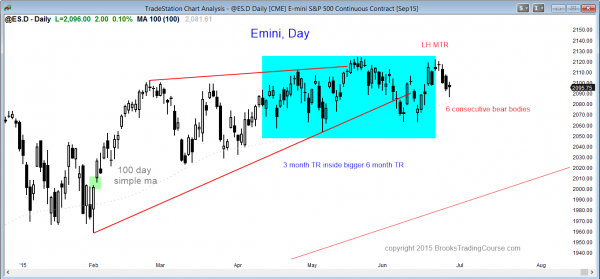
The daily S&P500 Emini futures candlestick chart is oversold over the past week, but 6 consecutive bear bars is a sign of selling pressure. This has not happened since January.
The daily S&P500 Emini futures candlestick chart is still in a 6 month trading range, but today is the 6th consecutive day with a bear body, and it follows 2 strong bear trend bars. The bears have not been this persistent since January, and it can be a sign of an impending bear breakout. Traders should be ready for a low probability event, like a gap down on Monday if Greece goes bankrupt this weekend or if some other totally unexpected event happens.
When a market is about to breakout, it often begins to trend before the breakout. The breakout can be to the upside as well, but I am going to talk about a bear breakout because that is what I believe we will get this year, whether or not there is a brief bull breakout first. The monthly chart is so unusually overbought and it is starting to bend over. We now have 6 consecutive bear bars on the daily chart. The Emini might be telling us that smart money is starting to sell more aggressively (sell out of longs, sell into shorts).
I remember in 1986, I bought some advertising on CBS radio for my surgical center. I noticed that crude oil prices were moving up quickly for several weeks, and the news mentioned it, but said no one knew why. When my ad ran during the next week, Reagan unexpectedly bombed Libya and crude oil soared…and I made about $50,000 from patients listening to CBS radio and then coming to me for eye surgery! The point is that when a market is in breakout mode, it often begins its new trend while still in the trading range, and it often does so with a series of 4 or more trend bars. We now have 6 bear bars.
Is this the start of the bear breakout? Who knows, but I have been doing this a long, long time, and I get suspicious when something unusual happens. I am not a conspiracy enthusiast, but I am pretty good at sensing when things are beginning to change. What is happening is consistent with a change. Sometimes there are false starts and this might be one. It probably is, like all of the other breakout attempts. But this is different from the rest and the stock market is about as overbought as it was in 1987, at least by one measure (the monthly moving average). Be ready!
Traders can see the end of the day bar-by-bar price action report by signing up for free at BrooksPriceAction.com. I talk about the detailed Emini price action real-time throughout the day in the BrooksPriceAction.com trading room, and a 2 day free trial is available.
When I mention time, it is USA Pacific Standard Time (the Emini day session opens at 6:30 am PST, and closes at 1:15 pm PST). You can read background information on the intraday market reports on the Intraday Market Update page.


I remember when Garzarelli and Zweig spoke about it as well as a gentleman who read sunspots I think. Haven’t heard of those folks since that era though.
I really like the input on how the big guys think AL.
Hi Al,
What do you think about EURUSD on weekly and monthly charts?
Thank you in advance!
Please read this (scroll down to see Forex comments):
https://brookstradingcourse.com/intraday-market-update/emini-update-learn-how-to-trade-breakout/
Thank you, Al !
By reading sentiment in the market it is apparent everyone is concern about it being overbought i think it was on last Friday that Cal Icahn was saying the same thing. Everyone now is giving price action more weight than ever. Any day we make a new high i ask myself does the market seems to accept the price or not? recently i start to have a feeling about the market that it does not want accept any higher prices. Most traders do not believe the market is fairly priced you can feel it as price make any new high or trying to prove it.
Example the new high we have made on 6/21 and the attempt to test it. since then i have been bearish and kept saying the same thing to my friend traders but during the same day 6/21 as i was saying in our forum that i expected test of 2067.25 everyone was so bullish and i was defeated. I din’t argue with them due to my probability being very low at that time but now since we are down 2086.00 it is better. i din’t mean to rely on that probability as i was trading but is something i have to factor into it giving the fact that everyone is talking about 10% correction including my mentor Al-brook.
I am ready, aware and following, as Al always advises ”Be ready!”
Well Al, you among all of us probably have the most experience. You have been mentioning this potential pullback for some time now. OB “definitely”, how about giving us some potential fundamental scenarios. All eyes are on Greece but what about China. Have you seen the Shanghai Index. Very weak price action there on a weekly.
We know you don’t focus on fundamentals but re-term it as “catalyst”.
I like to keep my eye also on potential catalysts that when coupled with price action seal the deal. I agree price action precedes the news maybe a tough one.
Have you any to offer?
Thank you for your well guided analysis
Yes, I have talked with my kids (well, adults now and in the business world) about China several times over the past few weeks. My thought is that it does not matter what causes the initial selloff. There is always some news event, and it usually has to be a surprise to create a big breakout. China and Greece are obvious and already somewhat discounted, but possible. I think it is more likely to be something unexpected. Whatever it is will cause the initial bear breakout. Once that happens, the technicals take over. The breakout will be strong enough for all of the momentum traders to believe that there will be follow-through selling, and they will begin to sell. Once they begin, the 10 – 20% drop begins. The news will say that it is due to the news event, but it is not. It is always because the market finally decided that it went too high and now needs to go lower to find buyers.
As for the 6 consecutive bear bars, I sent this to a friend today:
“I agree with you that this is not 6 consecutive bear bars with lower closes, which would be much more important. I still thing there is more than a 50% chance of one more new high. I mentioned in the weekly update that when a market begins to turn, the first attempt often fails, but it is a warning that the market is about to turn and it increases the chances that the following one will succeed.
It is like a 20 gap bar rally in a bear trend. It is usually not a reversal into a bull trend. Instead, it is a sign that the bulls are getting strong, and it usually means that the selloff that follows will be the final leg of the bear before a major trend reversal triggers. I think these 6 bear bars are the equivalent. They are the first sign that the bears can control the market for an extended time, and they increase the chances that if there is one more leg up, it will be the final one before the correction.”
Just wondering if the quarterly result season could be used as the trigger for the sell off to come. By the way, what do you think will happen on Tuesday, Al? Will markets fall if Greece breaks out or do you think it is already factored into the price action in place currently?
The Emini wants to fall because it is so overbought, and a news event will start the selling. It is just like sprinters in starting blocks wanting to run, but they have to wait for the gun to go off.
The markets have fallen many times in the past after a bad earnings report for a single company (this happened with MSFT a few years ago). However, the reason that they will fall is technical. Bulls have stops far away. The evolution into the weekly trading range is in part due to bulls reducing their position size. They have to because no firm is willing to allow the risk to grow forever.
Once there is a strong enough bear breakout for any reason, it might be enough to change the psychology. Traders will suddenly start talking about how overbought the market is. What they are saying is that they only want to buy TBTL (Ten Bars, Two Legs) lower, and they are talking about the highest time frame that has the pattern. This is the weekly or monthly chart. This means that a lot of traders will only consider buying after at least 10 weeks or even 10 months of sideways to down.
If they are finally taking profits after several years, they are not going to want to buy again a couple of weeks later. They will give the market at least 10 bars to see just how deep the reversal will be. If it then begins to stabilize, they will start to buy again. If the selloff is closer to 20% instead of 10%, the Emini might then enter a trading range that could last for more than a year.
Hi Al,
I appreciate the reminder that “Price Action” will always trump/precede the news. I did some research on the 87 crash last night, it seems Paul T Jones sent a message to George Soros of the impending correction to come (one week before it happened) The day of the selloff was not out of the blue there were many bear candles first. “Ding” the light bulb should have come on for many … maybe only those that did your course. I’ve analysed all major indicies weekly and daily and price weakness is apparent. However when I point this out to fellow traders they are discounting my thoughts and saying, “stop being a bear”. While this is initially discouraging, and has stopped me taking trades in the past. I won’t be making that mistake again. In fact in future I should really keep things to my self.
I went totally flat on the Friday before the crash. Even though I was just starting out, I had a sense that the selling was very unusual, and I was afraid of what might happen (and did happen) on that Monday. Several others talked about a possible crash during the week before (Elaine Garzarelli and Marty Zweig were two whom I saw discuss it).
Many thanks for your deep insight, Al, as usual. I will get ready.