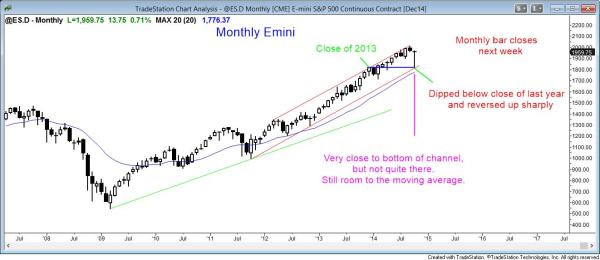
The monthly S&P500 Emini is reversing up sharply from a test of the moving average and last year’s close

The monthly Emini chart has been in a small pullback bull trend, which limits the downside over the next several bars. The Emini reversed up sharply from just above the moving average. It looks like it might test the September all-time high.
The monthly candle is a big reversal bar. It closes next week and the monthly chart will probably test the all-time high this month or next month. It is possible that the candle might become another outside up candle and go above and even close above last month’s high. Although an outside up bar is often a sign of strength, when it forms this late in a bull trend, it can be an exhaustive move and the start of a transition into a trading range. The test of the September high might create a micro double top.
The Emini has been sideways for 5 months, and it is more likely to continue sideways since this month’s low reversed up from above the moving average without touching the moving average. That means that the magnetic pull from the moving average will still tend to limit the upside potential, despite the strong reversal of the past month.
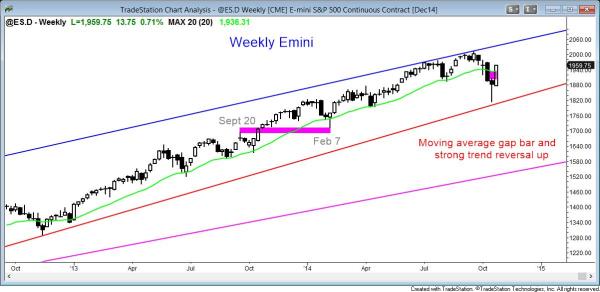
The weekly S&P500 Emini candle chart had a bull breakout and trend reversal after last week’s moving average gap bar

The weekly Emini chart reversed up from last week’s moving average gap bar (high below the moving average). When that happens, the rally usually becomes the final leg up before a major trend reversal forms.
This week was a strong breakout above last week’s high and it is therefore a strong entry bar for the bulls who bought the move about last week’s high. Last week was the first moving average gap bar (a bar with its high below the moving average) in a bull trend that has gone on for a long time (over a hundred bars = weeks). This usually leads to the final leg of the bull trend before a major trend reversal forms and leads to a pullback having at least two legs and lasting at least 10 bar. The reversal down can come from above or below the bull high (the September high).
The Emini weekly chart is in a strong bull trend and it does not have to form a trend reversal on the test of the high. However, that is what happens 60% of the time after a gap bar forms late in a bull trend. Most of these reversal lead to trading ranges, but about 40% lead to trend reversals that last at least 10 – 20 bars.
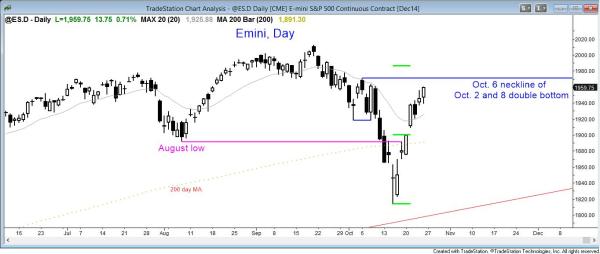
The daily S&P500 Emini candle chart has reversed up strongly and should test the October 6 and 8 lower highs next week

The daily Emini is in a strong bull breakout and it should test the October 8 lower high next week.
The daily Emini chart has a strong bull breakout. This means that the first reversal down will probably be bought and be followed by a second leg up. The Emini should get above the October 8 lower high next week and possibly the October 6 high as well. It might do this after Wednesday’s FOMC report. However, when there are two resistance levels near one another, the market sometimes goes above one and not the other. It then transitions into a trading range.
Also, traders have to remember that the selloff in the first half of the month was very strong. when the market sells off strongly and then reverses strongly, it usually then goes sideways for many bar. The reversal up has been so strong that it might continue up to a new high and then for a measured move up. However, until it breaks strongly above the all-time high, there is a reasonable chance that this rally will fail and create a major trend reversal.
The bears want this rally to fail and form a double top with the all-time high, or a lower high major trend reversal, which would be a right shoulder of a head and shoulders top. The bulls want the breakout above the high and then a measured move up. Although that is not likely when the monthly chart is this overbought, it is possible. Traders always have to consider both the bull and bear cases since the probability for both is almost always at least 40%, and it is usually about 50%.
Traders can see the end of the day bar-by-bar price action report by signing up for free at BrooksPriceAction.com. I talk about the detailed Emini price action real-time throughout the day in the BrooksPriceAction.com trading room, and a 2 day free trial is available.
When I mention time, it is USA Pacific Standard Time (the Emini day session opens at 6:30 am PST, and closes at 1:15 pm PST). You can read background information on the intraday market reports on the Intraday Market Update page.

