Monthly S&P500 Emini candle chart: Moderate follow-through buying, testing top of channel

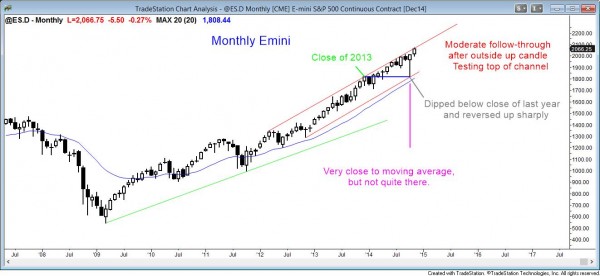
The monthly S&P500 Emini chart: Testing the top of the bull trend channel
There was a failed breakout of the all-time high 3 times over the past 5 days, but the monthly S&P500 Emini chart’s candle closed today and it was a moderate bull trend bar. This represents reasonable follow-through buying after last month’s outside up candle. However, it is now at the top of the bull trend channel and it is very overbought. The odds are that the bull breakout attempt will fail, but a breakout often takes up to 5 bars before a reversal takes place. Since this is a monthly chart, the breakout might continue for several more months before reversing. Less likely, there will be a successful bull breakout of the bull channel and the Emini would then return to bull breakout mode. This would result in an even stronger bull trend, which would eventually slow down and enter a channel again.
Weekly S&P500 Emini candle chart: SUMMARY

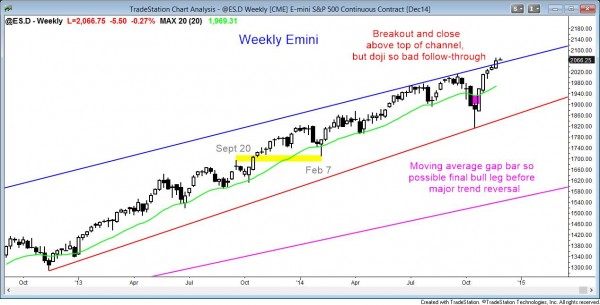
The weekly S&P500 Emini chart: Weak follow-through buying after last week’s breakout above the top of the bull trend channel
The weekly S&P500 Emini chart had a small doji bar this week. This is weak follow-through buying after last week’s breakout above the top of the bull trend channel. There is still a possible expanding triangle top on the weekly chart, but when a rally is as strong as this one has been, the bears usually need to create at least several bear bars before they can reverse the trend.
About 75% of channel breakouts fail within about 5 bars. This is 5 weeks on the weekly chart. There is also a breakout on the monthly chart, and it might take 5 months to reverse. Whether the reversal takes place in 1 week, 5 weeks, or 5 months, it is more likely than a continued bull trend.
However, the reversal might simply result in a trading range for 10 bars or so on the weekly or monthly charts. If so, the bull trend could then resume and the channel could continue up. This can happen without a new strong breakout phase and a new, stronger bull trend.
Channels can last a long time and have many failed breakouts, followed by reversals into the channel and then another leg up. Until there is a strong breakout below the channel, the bull trend is intact. Once there is a strong breakout below the channel, traders will begin to look to sell the next rally, expecting a major trend reversal.
Daily S&P500 Emini candle chart: Tight trading range, so weak follow-through after the breakout above the channel

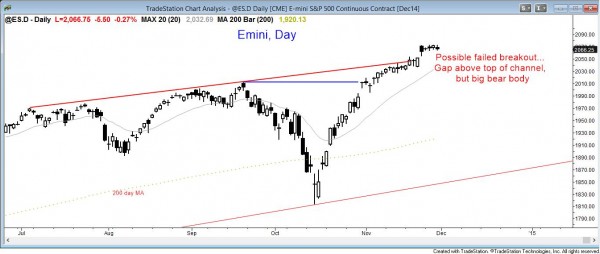
The daily S&P500 Emini chart: tight trading range after breaking above the channel
The daily S&P500 Emini chart broke to a new all-time high 3 times this week and sold off each time. Although the daily chart this week is in a tight trading range, it is actually also a small wedge top. If Monday gaps down, this week would become an island top. Island tops and bottom often lead to reversals. Since the Emini is at the top of bull trend channels on the daily, weekly, and monthly charts, and most channel breakouts fail, traders will be ready to short if the Emini begins to reverse down next week or soon after.
Unlike the weekly and monthly charts, which are in strong bull trends, the daily chart has been in a trading range since June, and the current rally is an attempt to break above the range. This two month rally has been very strong, but it is still an attempt to break out of a trading range, and most breakout attempts fail. The bulls need much stronger follow-through buying before traders will believe that the breakout will likely succeed and lead to a measured move up.
Without that, this breakout will probably soon fail. There is no sign of a top yet, but if there is a gap down or a strong bear breakout next week, traders will become increasing confident that the trading range is still intact. They will then look for at least two legs down on the daily chart.
Traders can see the end of the day bar-by-bar price action report by signing up for free at BrooksPriceAction.com. I talk about the detailed Emini price action real-time throughout the day in the BrooksPriceAction.com trading room, and a 2 day free trial is available.
When I mention time, it is USA Pacific Standard Time (the Emini day session opens at 6:30 am PST, and closes at 1:15 pm PST). You can read background information on the intraday market reports on the Intraday Market Update page.

