Monthly S&P500 Emini candle chart: Sell signal bar forming
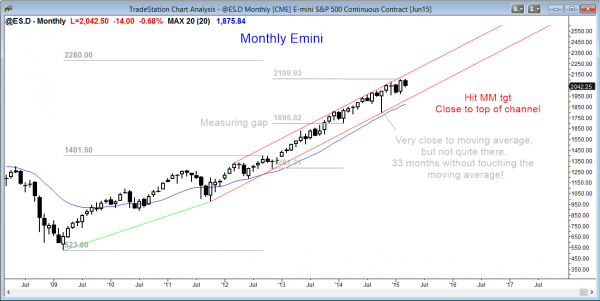
The monthly Emini candle chart is forming an ioi sell signal in an overbought bought bull trend, but there is still a lot of time before the bar closes and it could look bullish by the end of the month.
The monthly S&P500 Emini candle chart has an bear inside candle and a possible ioi sell signal bar so far this month, but the month is only half over. It is too early to predict how the candle will look at the end of the month. Because the monthly chart is exceptionally overbought, a 20% correction is likely this year and it can start at any time. However, it is still in a small pullback bull trend with no reversal yet and this rally can continue for many more months.
Once the reversal comes, the first downside target is the rising moving average, which is now around 1875. Since a 20% correction is likely this year, if it has begun, that would result in a drop below the October low of 1798.50.
Weekly S&P500 Emini candle chart: Test of the moving average
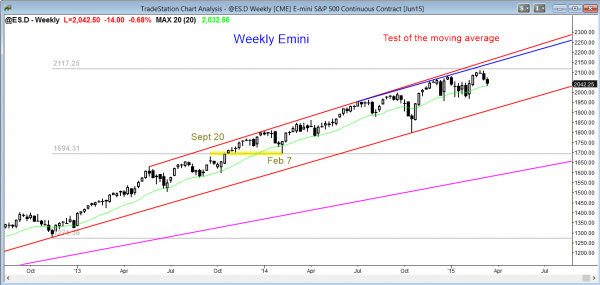
The weekly Emini candle chart is still in a bull channel. Bulls have been buying pullbacks from every new high and they might buy this one, too. It is testing the moving average, but most prior tests over the past year fell below the average by 20 or more points.
The weekly S&P500 Emini candle chart has pulled back to the weekly moving average, which has been support for 3 years. However, most of the prior tests fell below by at least 20 points, so this one probably will as well. Many bulls will hesitate to buy until they see a deeper pullback that then reverses up.
The bulls are hoping that the selloff of the past 3 weeks is simply a pullback to test the moving average and the breakout above the January tight trading range. The bears are hoping that the tight trading range is the final flag in the bull trend. It is too early to know, and the current selloff is not yet strong enough for traders to believe that it is the start of a bear correction. However, if it begins to form consecutive strong bear trend bars, traders will begin to think that there might be at least a TBTL Ten Bar, Two Leg selloff.
Daily S&P500 Emini candle chart: Pullback in a bull trend or a bear breakout
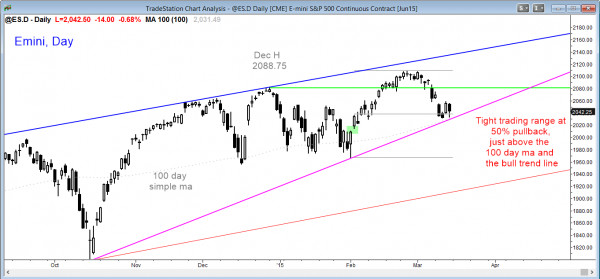
The daily Emini candle chart is stalling at a 50% pullback from the February rally. It is deciding between a resumption of the bull trend and a bear trend reversal.
The daily S&P500 Emini candle chart has pulled back 50% from the February rally and is stalling. The market might resume up or reverse down. It is just above a bull trend line and it should test below it within a week or two. It is also just above the 100 day moving average, which has been support over the past 3 years. Like prior tests, this one will probably have to fall below the average and reverse up strongly before bulls will be willing to buy aggressively.
Traders can see the end of the day bar-by-bar price action report by signing up for free at BrooksPriceAction.com. I talk about the detailed Emini price action real-time throughout the day in the BrooksPriceAction.com trading room, and a 2 day free trial is available.
When I mention time, it is USA Pacific Standard Time (the Emini day session opens at 6:30 am PST, and closes at 1:15 pm PST). You can read background information on the intraday market reports on the Intraday Market Update page.


