Monthly S&P500 Emini futures candlestick chart: Double top
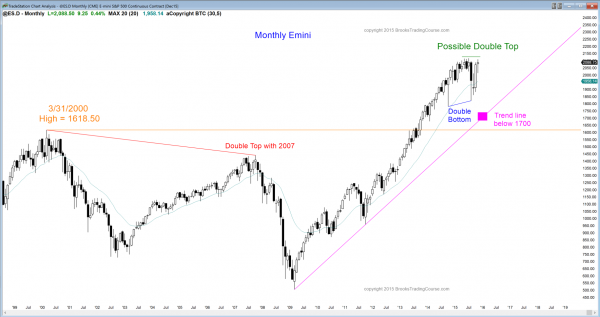
The monthly S&P500 Emini futures candlestick chart is testing the all-time high, creating a possible double top.
The monthly S&P500 Emini futures candlestick chart reversed up from the 20 month moving average last month after 38 months above the average after forming a double bottom with the October 2014 low. It is now testing the all-time high. It is giving traders a chance to learn how to trade a rally that might create a top. If it fails to break above that high and begins to turn down, traders will see the candlestick pattern as a double top on the monthly chart. The first top lasted about 7 months The current top has lasted only about a month. If the monthly chart is forming a double top, the Emini could go sideways for many more months and still have a symmetrical and therefore reliable pattern for the bears. The bears do not yet have a signal bar, nor do they have a strong reversal down. Those learning how to trade the markets should see the monthly chart as still in a bull trend. Traders who trade the markets for a living know that even a break below the October low will still only be a bull flag unless the bear breakout is very big and has one or two strong follow-through bars. Since this is a monthly chart, that would take many months. In the meantime, the monthly trend is still up.
Weekly S&P500 Emini futures candlestick chart: Learn how to trade a rally that might create a top
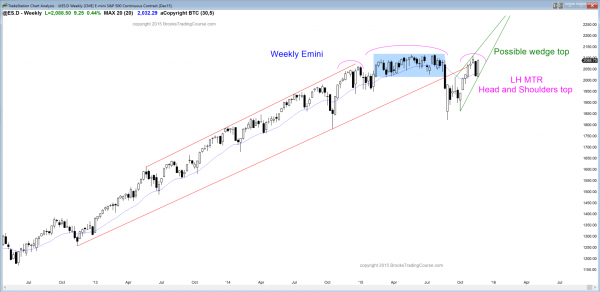
The weekly S&P500 Emini futures candlestick chart is forming a possible head and shoulders top. If there is a breakout to a new all-time high, the bears will look for a reversal down from a wedge top, which would also be a higher high major trend reversal.
The weekly S&P500 Emini futures candlestick chart has the most interesting price action. Unless it breaks above the July all-time high, it is still forming a double top or slightly lower high major trend reversal. This rally is also a right shoulder in a yearlong head and shoulders top. If the bulls get a new high, traders will look for either a strong bull breakout and a measured move up, maybe from the gap below this week’s low and the September high, or a failed breakout and a reversal down. If there is a reversal down from a new high, the bears will see it as a wedge top and a higher high major trend reversal. It would also be a failed breakout above a 7 month trading range that formed after a 6 year rally. That trading range would then be the final bull flag, and the reversal down would be a final flag reversal.
This week formed an outside up candlestick pattern because it traded below last week’s low and then above last week’s high. It also closed above last week’s high, which is a further sign of strong bulls. Since last week was a big bear then bar, this week was a reversal and a buy signal bar for next week. The bulls want a strong breakout above this week’s high and then above the all-time high. They would like December to close above the July high as a sign of strength. If it closes far enough above it, the bulls will see that gap between the close of the breakout bar and the July high as a possible measuring gap. If there is a pullback after the breakout, but the low of the pullback does not fall below the July high, the space between would also be a gap. Their target would be a measured move up based on the 350 point height of the yearlong trading range.
The momentum up from the October low favors a breakout to a new all-time high. The strength of the August selloff favors a double top. The two cancel each other out, and there is about a 50% chance of either occurring. If the bulls get a new all-time high, there is about a 40% chance of a measure move up and a 60% chance of a failed breakout. The failure could lead to either a bear trend or a prolongation of the yearlong trading range.
Daily S&P500 Emini futures candlestick chart: Trading range price action
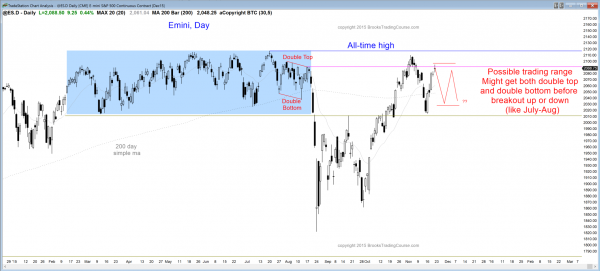
The daily S&P500 Emini futures candlestick chart is in a trading range since its buy climax 2 weeks ago. The trading range might continue for a month or more and form both a double top and double bottom, like it did in July and August.
The daily S&P500 Emini futures candlestick chart had two strong legs up from the August bear trend and it is still within its yearlong trading range. Trading ranges usually have many two-legged strong moves up and down that usually look strong enough to breakout, but each strong leg fails and then reverses. This rally so far is another example. Until there is a breakout, there is no breakout, and the odds favor a continuation of the trading range.
The October rally was a buy climax. The November reversal down was strong enough to make a trading range over the next few weeks more likely than a breakout to a new all-time high. If there is a trading range, bulls will see it as a double bottom bull flag, and the bears will see it as a double top lower high major trend reversal, expecting a reversal down from the October rally.
Once a trading range grows to 20 or more bars, the price action that preceded it loses its influence. Eventually, the probability of the trading range being a bull flag falls to about the same as the probability that it is a topping pattern. The trading range has not lasted long enough yet to be free of the bullish influence of October, and the probability of at least a test up to the November high is greater than the probability of a reversal down.
Thursday and Friday formed doji bars on the daily chart after Wednesday’s strong rally. Friday’s gap up closed when Friday traded below Thursday’s high. These are signs of weak follow-through buying and they increase the chances of limited follow-through buying next week. The bears want a reversal down early next week and then a trading range for several weeks. They then hope for a major trend reversal down and a bear trend. The bulls do not want to lose their momentum and want a breakout to a new all-time high next week. If the breakout has a lot of momentum, the odds of much higher prices would be greater. They want to see a series on consecutive big bull trend bars closing on their highs. While this can happen, it is not likely. If the bulls get their breakout, the follow-through will probably be bad because the monthly chart is so overbought and the yearlong trading range will be a magnet that will make it difficult for the bulls to get a strong bull breakout.
Traders can see the end of the day bar-by-bar price action report by signing up for free at BrooksPriceAction.com. I talk about the detailed Emini price action real-time throughout the day in the BrooksPriceAction.com trading room, and a 2 day free trial is available.
When I mention time, it is USA Pacific Standard Time (the Emini day session opens at 6:30 am PST, and closes at 1:15 pm PST). You can read background information on the intraday market reports on the Intraday Market Update page.


