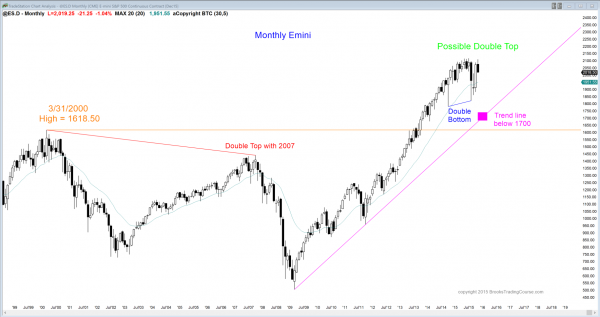
Monthly S&P500 Emini futures candlestick chart: Double double bottom bull flag and double top
The monthly S&P500 Emini futures candlestick chart is forming a potential double top after a double bottom bull flag.
The monthly S&P500 Emini futures candlestick chart stayed above the 20 month EMA for 38 months. That is a sign of strength and it is a buy climax. Traders bought during October as it moved above the September high, which was the neckline of the 2 month double bottom bull flag. However, September was a doji candlestick pattern, and that is a weak signal bar. When a high 1 buy triggers and there is a weak signal bar, even though the October entry bar was strong, the market is more likely to go sideways than up. The selling of the past 2 weeks is consistent with that.
The bulls see the 38 months above the moving average as a sign that the Emini is going much higher. They see the yearlong trading range as a bull flag and expect a breakout to a new all-time high and then a 300 point measured move up. They have about a 40% chance of that happening before a test down to the October low.
The bears see the rally as a test of the July all-time high, and they are shorting, expecting a double top. They want a breakout below the October low, which is the neck line of the double top, and then a measured move down for about 350 points below that. The monthly chart broke strongly above a double top from 2000 and 2007. At a minimum, the bears want a test of the 2000 high, just below 1600, and a test of the bull trend line, which is now below the double bottom formed by the 2014 and 2015 October lows.
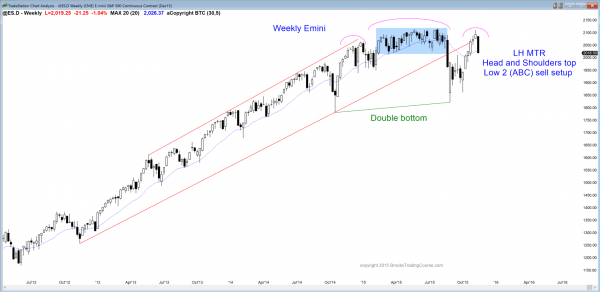
Weekly S&P500 Emini futures candlestick chart: Learn how to trade a head and shoulders top
The weekly S&P500 Emini futures candlestick chart turned down from a lower high major trend reversal (here, a head and shoulders top) and a low 2 sell setup.
The weekly S&P500 Emini futures candlestick chart had a 2 legged rally that turned down from just below the all-time high. The bears see the rally as a lower high major trend reversal. It is also a head and shoulders top and a Low 2 sell setup (an ABC rally). However, the 2nd leg up had 6 consecutive bull bars closing above their midpoints. This is enough buying pressure so that the bulls will probably buy the current reversal down next week.
When there is a strong rally, bulls usually buy the first pullback. If the pullback grows to 3 bear bars and they all close near their lows, then the odds are that the 1st rally after that will be sold, and then the best the bulls usually get is a trading range for several weeks.
This makes the next 2 weeks important. If the bears can get 2 more strong bear trend bars on the weekly chart, the odds of a new all-time high will fall from the current 50% back down to around 40%. If the bulls are able to create a strong bull reversal next week or the week after, the bulls will then still have a 50% chance of an all-time high.
If they get their high, it will be a 3rd push up from the August low. This would be a type of wedge top. Bears will look to sell a reversal down. Even of the bulls get a new all-time high, the odds are that they will not get their 350 point measured move up. More likely, the new high will fail within 5 weeks or so, and the yearlong trading range will then be the final bull flag in the 6 year bull trend.
The weekly moving average has been reliable support and resistance for years. This selloff is testing it again. The odds are that the bulls will buy here or just below next week, just as they have been doing since the 2009 low. If the Emini breaks strongly below it, it will then be resistance, like it was in September.
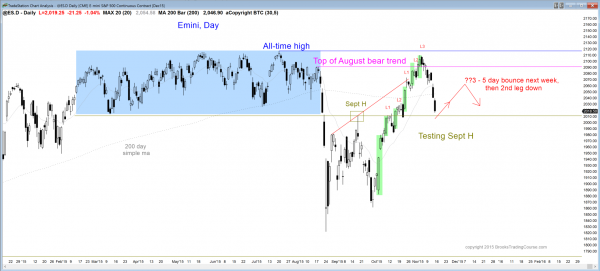
Daily S&P500 Emini futures candlestick chart: Buy climax followed by sell climax
The daily S&P500 Emini futures candlestick chart is reversing down strongly to support at just below today’s low.
The daily S&P500 Emini futures candlestick chart had 6 consecutive buy climaxes in its 6 week rally. I have talked about this many times over the past 2 weeks. The odds were that there would be a TBTL (Ten Bar, Two Legs) pullback. The current 1st leg has lasted almost 2 weeks. Yesterday’s bear breakout and today’s follow-through were strong enough so that the 1st attempt to reverse back up will probably fail after a day or two.
The resumption down will probably also be brief because bulls will look to buy a micro double bottom after 2 weeks of climactic selling down to test support. The support is the September high, the bottom of the February to August trading range, the 2,000 round number, and a 50% pullback from the October rally. Their buying will probably create a 3 – 5 day bounce.
Bears will sell around a 50% pullback from this 2 week selloff. Their selling would then likely be the start of the 2nd leg down. If the does test down after a 1 – 5 day bounce, it will create a potential double bottom bull flag. Bulls will look to buy a breakout above that bull flag, hoping for a new all-time high. This double top and double bottom would create a trading range. If both form, the Emini will be in breakout mode, with a 50% chance that the successful breakout will be up and a 50% chance it will be down.
Traders can see the end of the day bar-by-bar price action report by signing up for free at BrooksPriceAction.com. I talk about the detailed Emini price action real-time throughout the day in the BrooksPriceAction.com trading room, and a 2 day free trial is available.
When I mention time, it is USA Pacific Standard Time (the Emini day session opens at 6:30 am PST, and closes at 1:15 pm PST). You can read background information on the intraday market reports on the Intraday Market Update page.


Hi Al,
The Forex markets are heavily affected by macroeconomic data. How does a trader reconcile price action and such catalyst events? We know that each pair comprises data from both currencies. If one trades the 4H charts it is almost inevitable that he will always have open positions during those events.
How does a price action trader deal with the macroeconomic catalysts?
Thanks,
Flavio
Al thanks for all your help and guidance this week! great stuff as always!
Have a nice weekend! Kathy
Thanks for your analysis as always Al!
What do you make of the breakout attempt in crude? I have the price finding support at the leg1=leg2 projection on the daily chart, and testing the bottom of the August 27th rally. So the TR should continue, right? But the weekly chart looks more like a bear flag which is now over and about to make a new low…. Surely the market can’t go much further; even lower oil prices would be disastrous for the world economy, no?
The weekly bulls want a double bottom. At the moment, I think a wedge bottom is more likely. Although it might get a 20 handle, it looks more like it will bottom in the low 30s or higher.
As far as the world economy goes, energy is one small piece and therefore greatly overshadowed by all of the other pieces. I am not at all worried. I have seen many predictions of doom over my 30 years of trading, and many were far worse than this. Not only do we survive, we continue to get so much better. The 87 and 2007 crashes were much more emotional. Worst case over the next year is a 20+% drop in the stock market, which would probably be a great buy.