Monthly S&P500 Emini candle chart: Strong bull trend, but overbought

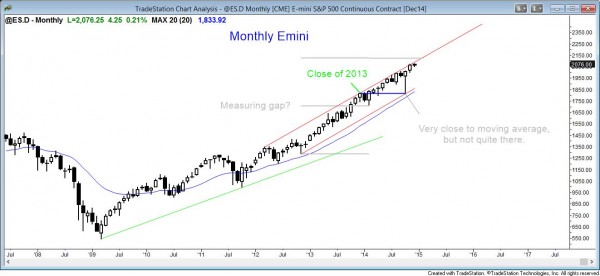
The monthly S&P500 Emini chart is in a strong bull trend and there is no sign of a top.
Although the monthly S&P500 Emini candle chart is extremely overbought, the first reversal down probably be bought, as is the case with small pullback bull trends. There is a potential measured move target around 2120, based on the October 31 measuring gap. This gap is the same as the one on the weekly chart that I describe below.
Weekly S&P500 Emini candle chart: Strong bull trend, but top of channel

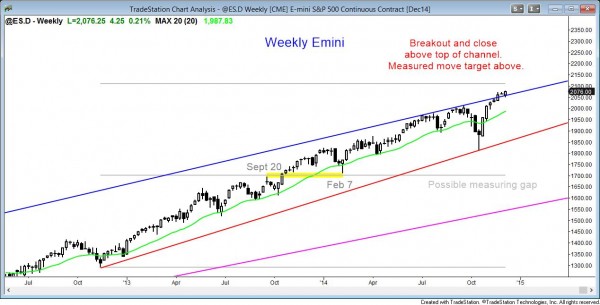
The weekly S&P500 Emini chart is in a strong bull trend and there is no sign of a top.
The weekly Emini candle candle chart has a measured move target around 2120 that is based on the gap created when the February 7th low tested the high of September 20, 2013. Although the Emini is at the top of the channel, there is no sign of a top. The bears will probably need several weeks of sideways trading before they can create a credible potential top. Less likely, there can be a big bear breakout at any time. Until then, the Emini will probably work higher and test the measured move target above.
Daily S&P500 Emini candle chart: weak follow-through after strong bull breakout

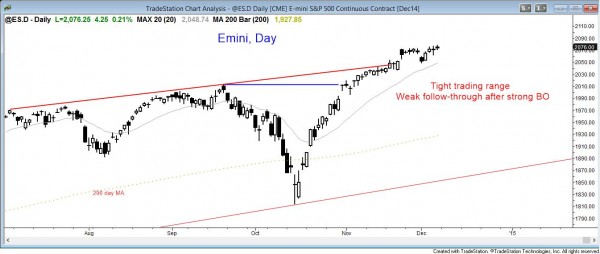
The daily S&P500 Emini chart is in a strong bull trend, but it is also in a two week tight trading range. This is weak follow-through from the breakout above the September high, and it might lead to a breakout test of the high. However, there is no sign of a top yet.
The daily S&P500 Emini chart is stalling after a strong bull breakout. This increases the chances that it will test down to the September high. However, there is still a measured move target above and the stock market is likely to reach it whether or not it tests down first. Until there is a credible top or a strong bear breakout, the bulls will continue to own the market and any shorts are just trades (scalps) and not investments (swing trades).
Traders can see the end of the day bar-by-bar price action report by signing up for free at BrooksPriceAction.com. I talk about the detailed Emini price action real-time throughout the day in the BrooksPriceAction.com trading room, and a 2 day free trial is available.
When I mention time, it is USA Pacific Standard Time (the Emini day session opens at 6:30 am PST, and closes at 1:15 pm PST). You can read background information on the intraday market reports on the Intraday Market Update page.

