Monthly S&P500 Emini futures candlestick chart: More sideways to down likely
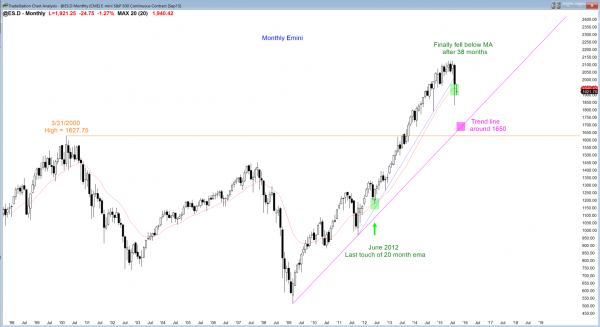
The monthly S&P500 Emini futures candlestick chart finally pulled back to the moving average after 38 months above it.
The monthly S&P500 Emini futures candlestick chart pulled back to the moving average after an extreme buy climax. The two prior times in the past 50 years when the S&P cash index stayed above its moving average this long were followed by 36% and 22% corrections. The odds favor more than the 10% down that the market has had so far. However, even though staying above the moving average this long is unsustainable and therefore a buy climax, it is also a sign that the bulls are strong. That is why there has been buying. Bulls were so eager to buy that they have been willing to pay an above average price for 38 months. They now finally can buy at an average price, and many are doing just that.
However, when there is such an extreme climax, the pullback usually lasts about 10 bars and has at least 2 legs. Ten bars on the monthly chart is about a year. This means that 2016 will probably be sideways to down for most of the year. Obvious downside targets are the October low. There is about a 50% chance that the Emini will get there and have about a 20% correction. See the daily chart and I marked the 20% level, which is 1701. That is also below the bull trend line from 2009.
If it gets there, traders will begin to talk about a breakout test of the double top at 1627.75. The monthly chart is still in a bull trend, and even if it falls to 1,600, which is unlikely, the selloff would still be a bull flag. However, this would take many months and traders would need a strong buy candlestick pattern or a breakout above the bear channel (bull flag) before they conclude that the bear trend on the daily chart had ended.
Weekly S&P500 Emini futures candlestick pattern is a head and shoulders top in its early stage
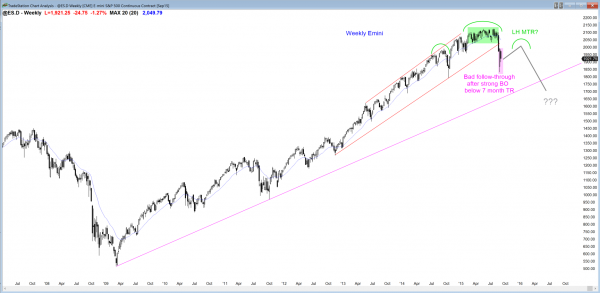
The weekly S&P500 Emini futures candlestick chart had no follow-through selling after the strong bear breakout. This increases the chances for a bounce. The bounce will probably be sold, and this would form a lower high major trend reversal, which would also be a head and shoulders top.
The weekly S&P500 Emini futures candlestick chart had bad follow-through selling after the initial leg down. The bulls see the reversal up as a double bottom with the October low. The bears see it as a strong bear breakout. They know that a trading range or bear rally is likely, but they also know that the odds are that the rally will be sold. If so, the lower high would create a lower high major trend reversal, and traders learning how to trade the markets should then look for a sell candlestick pattern or a strong bear breakout to sell for a swing down.
Since there was a pullback from the September high, that high formed a left shoulder, and the pattern is also a head and should tops. Reversal patterns have a 40% chance of success, and a 60% chance of continuing in the trading range or of reversing up. The probability is always low when the profit potential is good and the risk is relatively small compared to the reward. There always has to be a reason to take the other side of your trade. Otherwise, no one would take it and your trade would never trigger. If you get great risk/reward, the institution on the other side get high probability of profit (and you get low probability).
Daily S&P500 Emini futures candlestick chart: Bear flag
The daily S&P500 Emini futures candlestick pattern is a bear flag
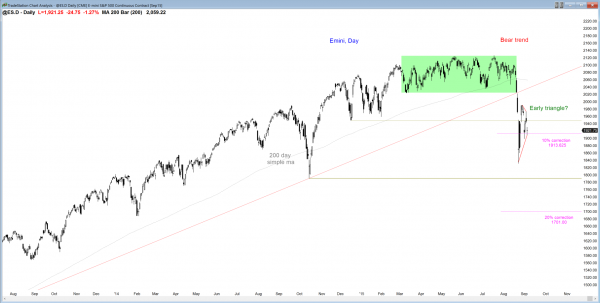
The daily S&P500 Emini futures candlestick chart is pausing after a huge bear breakout. While it is possible that this selloff will be like October, 2014, the selling was much more severe this time, the context was better for the bears (a strong bear breakout below a 7 month trading range), and the rally off the lows lacked the strong follow-through buying of last year. This is a big problem for the bulls, and it increases the chances that whatever trading range we get over the next month or two will form a lower high, and it will be followed by a 2nd leg down.
All bear trends end at support, and most end at some measured move target that is based on the size of the initial bear breakout. Since the first leg down was about 270 points, the 2nd leg down might form a leg 1 = leg 2 measured move and also fall for about 270 points. How high will the bear rally go? The 2020 – 2050 bottom of the 7 month trading range is an obvious magnet. If the 2nd leg down begins there, a measured move down would be about 1750 – 1780, which is around the October low.
If instead we have already seen the top of the bear rally last week at around 1990, then the target would be around 1720. Suppose there is a rally to last week’s high and it forms a double top bear flag. If the market then races down to the bear low and gaps below it, the measuring gap would project down to around 1670, which is below the monthly trend line and getting close to the breakout point of the March 2000 high of 1627.75.
The chance that the bulls are right and that this is like October last year is maybe 40% at the moment. However, if they are able to prevent a bear breakout to a 2nd leg down for several months, the odds will get closer to 50%. Right now, the price action favors the bears.
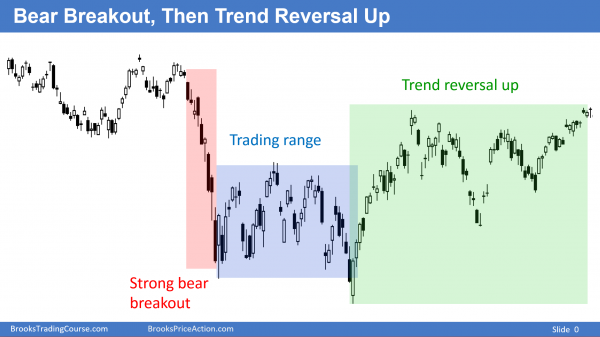
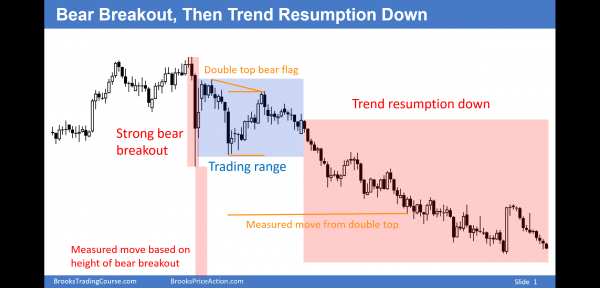
I sent this to Investing.com today and I do not know if they will post it: S&P: 2nd leg down still more likely Whenever there is an exceptionally strong bear breakout, bears are surprised by the gift of big, quick profits and they are eager to take them. The result is that the bears buy at the bottom of the strong bear breakout. Bulls see that big breakout as a brief opportunity to buy at a great discount, and they buy as well. Both know that the breakout was strong enough so that the bulls will be unlikely to hold onto their positions long. They will take fast money on a brief rally. They will sell the bounce for a scalp. The bulls who did not sell out of their longs will use the rally to sell with a smaller loss. The bears know that the 1st rally will probably fail, and they will sell again. The bears who did not sell originally now believe that the bears own the market and are eager to sell the pullback (bear rally), and they sell as well. The result of bulls and bears selling the rally is another leg down. When a breakout is exceptionally big, as the one on the daily S&P chart was, this process can repeat several times. This creates a trading range. At first, the probability of a bear trend is greater than that of a reversal back up. If the trading range grows to 20 or more bars, then the probability for the bulls becomes close to that of the bears. Since the current trading range on the daily chart is still only about 10 bars, the probability of a bear trend is still greater. If the bulls can prevent a bear trend for another few weeks, then traders will begin to consider the possibility that the bear breakout was a bear trap and that the bear trend will reverse up. Here are examples of the two common outcomes after a strong bear breakout.
Fig.1. After the strong bear breakout, there was a trading range. The bear breakout below the trading range failed, and the bulls were able to reverse the trend back up.
Fig. 2. The bears got a breakout below the trading range. The minimum target is always some kind of measured move down. A measured move based on the height of the trading range is common, and many computers take partial profits at the target. Another common support level is the measured move based on the height of the original bear breakout. This is an example of a Spike and Channel bear trend, which is a common pattern (the bear breakout is the spike).
No one knows which of these two outcomes will follow the bear breakout in the S&P. Because the breakout was so exceptionally strong and the trading range has not lasted long, the odds are that the bear breakout will be followed by a bear trend that will continue for at least some kind of measured move. However, if the bulls are able to form a trading range that lasts 20 or more bars, they will begin to see buy setups within the trading range, and the odds for the bulls will begin to approach those of the bears. At the moment, the odds still favor the bears.
Traders can see the end of the day bar-by-bar price action report by signing up for free at BrooksPriceAction.com. I talk about the detailed Emini price action real-time throughout the day in the BrooksPriceAction.com trading room, and a 2 day free trial is available.
When I mention time, it is USA Pacific Standard Time (the Emini day session opens at 6:30 am PST, and closes at 1:15 pm PST). You can read background information on the intraday market reports on the Intraday Market Update page.


Hello Al,
We’ve had the bounce and then a retest of the bounce with no takers.
On a 4 hr chart we’ve had a failed break out of a triangle pattern. It looks to me that we are now headed lower. Confirmation for this is if the 4hr trendline gets broken.
My question relates to when higher lows or lower low MTR’s happen.
Can you share with us the psychological differences between these 2 when they form. EG what are traders thinking to create a higher low MTR and what are traders thinking when a lower low MTR is formed. Hopefully I have the correct terms in tact. Thanks for you analysis and answers.
Great stuff Al! Thanks for this.
Any thoughts on the very interesting price action in crude oil this last two weeks? Looking at the daily chart, do you think we’ll get another leg up to a measure move based on the strong bull spike (8/27,8/28,8/31)? The odds seem to favour a spike and channel bull. Or do you think we need to test down first to form a credible bottom?
In crude oil, the bulls are hoping that the reversal up was a climactic end of the bear trend. However, the reversal up was minor on the daily and weekly charts, and that means that the best the bulls can reasonably hope to get is a pullback into a trading range. If the trading range grows for 20 or more bars, they have a 40% chance of a major trend reversal. Until then, this strong rally is most likely another bear flag. There might be one more leg down. if so, a reversal up could form a big wedge bottom on the daily chart, and the rally could reach the top of the wedge around 65.
Hello Al,
If the odds right now favor this bull breakout on the daily chart becoming a bear flag, does the odds favor a MM down of the bull breakout? I say this because the bulls will likely fail to get a measured move up, so I’m curious to know what the odds of a MM down based on the bull breakout are? Thank you for you time. Amazing Weekend update, your work is truly appreciated.
Yes, the odds favor a MM down, and I mentioned that in the update, but it might be easy to overlook because the update is long:
“All bear trends end at support, and most end at some measured move target that is based on the size of the initial bear breakout. Since the first leg down was about 270 points, the 2nd leg down might form a leg 1 = leg 2 measured move and also fall for about 270 points. How high will the bear rally go? The 2020 – 2050 bottom of the 7 month trading range is an obvious magnet. If the 2nd leg down begins there, a measured move down would be about 1750 – 1780, which is around the October low.”