Monthly S&P500 Emini futures candlestick chart: Testing top of bull flag
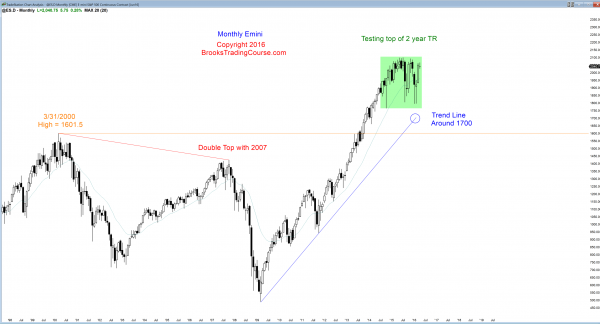
The monthly S&P500 Emini futures candlestick chart has still not broken above the 2 year bull flag, despite the strong 2 month rally.
The monthly S&P500 Emini futures candlestick chart continues to have 1 – 2 big bars up and down in a tight trading range. Since it is still in a bull trend, it is a bull flag. Because the bull trend was so climactic, the odds still favor a deeper pullback. That means a break below the range and a measured move down. Until there is a breakout, there is no breakout.
The probability slightly favors the bears because of the buy climax and the series of lower highs and lows. Since the chart is climactic, if there is a bull breakout, this trading range will probably be the final bull flag before a correction down comes. After an extreme buy climax, the reversal should last at least 10 bars (months), have at least 2 legs, and fall for about a measured move down based on the 300 point tall trading range (target around 1,500).
Less likely, the bulls will get a bull breakout and a 300 point measured move up. Even if they do, this trading range will still probably be the final bull flag before there is a 20% or more correction.
Weekly S&P500 Emini futures candlestick chart: Consecutive buy climaxes at top of trading range
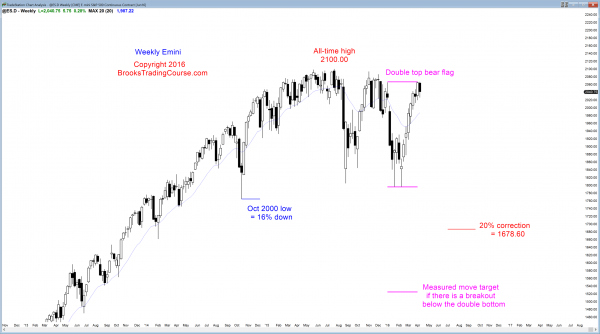
The weekly S&P500 Emini futures candlestick chart has a micro double top with the high of 2 weeks ago and a big double top with the December 29 lower high. It is still forming lower highs, despite the strong rally of the past 8 weeks.
The weekly S&P500 Emini futures candlestick chart had a bear bar 2 weeks ago after 6 bull bars. After the 6th bull bar, I said that the next week would probably have a bear body, and it did. This is because that is what usually happens after a 6 bar buy climax on the weekly chart. I also repeatedly said that probability favored that there would probably be buyers below the bear bar, that there would be one more new high, and that the rally would last only 1 – 3 bars (weeks). Finally, what usually happens is a pullback lasting about 10 bars, forming a trading range. This final step might have begun this week.
It is always possible for the bulls to continue up in a channel and break to a new all-time high. The scenario that I have been describing over the past several weeks was more likely and it is currently unfolding. Nothing is 70% certain, but I thought the odds of each of the past 4 – 5 weeks doing what they did were about 6 out of 10.
The current rally is forming a double top lower high major trend reversal with the December 29 lower high. It is a double top bear flag that is following the selloff from the July high, even though it is also part of a trading range. The neck line is the February low, and the measured move projection is down around 1,500. If the Emini rallies further, like to the top of the October to December trading range, this pattern is still possible, and it remains possible unless the Emini breaks to a new all-time high. If it does, the bears will look for a different pattern.
These double top lower high major trend reversals never look bearish. This is because they form within a trading range, and the 2nd high usually follows a strong rally, like the one in February and March. However, if there is a good signal bar, and especially if there is a strong reversal down, the probability that the leg down would lead to the bear breakout would be at least 40%. There is about a 55% chance of a bear breakout, but the chance that the next selloff would be the attempt that finally succeeds is about 40%. That is because major trend reversals only lead to big reversals 40% of the time.
Daily S&P500 Emini futures candlestick chart: Candlestick patterns have created breakout mode price action
The daily S&P500 Emini futures candlestick chart’s rally has evolved into a trading range
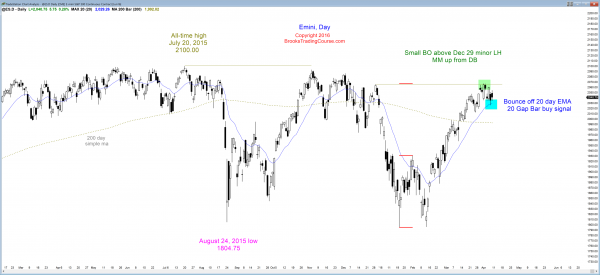
The daily S&P500 Emini futures candlestick chart is in Breakout Mode, and it is a nested pattern with the monthly chart. Both had climactic rallies and are deciding if the trading range is a bull flag or a topping candlestick pattern.
The bulls had their 1st chance to buy at the 20 day EMA on Thursday after only being able to buy at an above average price in over a month. Many bulls bought the brief discount, and this created a bounce over the past 2 days. However, despite the bounce, both days ended with bear bodies. That is disappointing for the bulls, and disappointment is a hallmark of a trading range.
Since late February, I have said repeatedly that March’s strong rally was more likely going to end up as part of a trading range, like the late October rally, than be the start of a breakout to a new all-time high. The trading range is now clear. The Emini has been in a 300 point tall trading range for 2 years. That trading range contains 4 small trading ranges. Each was a month or more long and about 100 points tall. This one will probably be similar.
When a market is in a relatively tight trading range (here, about 55+ points for the past month), and a bigger range is likely, the Emini eventually breaks out of the range, up or down, and travels for about a measured. When the market is at the top of a trading range (here, it is at the top of a 2 year range), a reversal down is more likely than a successful bull breakout. The odds favor a bear breakout and about a 50 point measured move down.
When all the technicians agree that the odds favor a bear breakout, and they do now, that creates a possible pain trade. A pain trade is an unlikely event. If sideways to down is likely over the next month, a bull breakout to a new all-time high is unlikely. If the Emini breaks above the other 2 lower highs in the October – December trading range, it will probably break to a new all-time high. Since that is not likely, bears will be more willing to use a wide stop and to scale in above the July all-time high.
This sets up a potential bear trap. The rally could move relentlessly higher in a weak bull leg where there are not many strong bull trend bars, the tails are prominent, and there are many bear bodies. Many traders will mistaken this for a weak breakout and they will continue to sell at and above every little top.
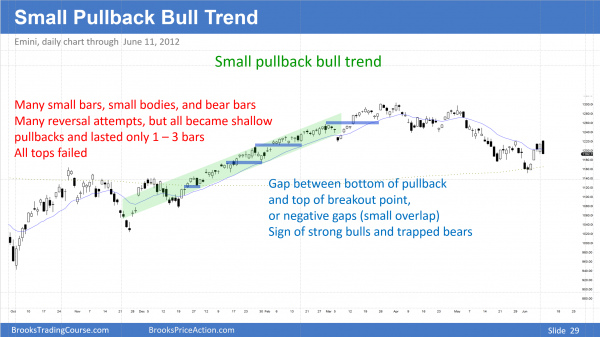
Small pullback bull trend. The rally has weak bull bars and it looks like it is constantly trying to reverse. However, the pullbacks are shallow and last only 1 – 3 bars, and there are gaps between the pullbacks and the breakout points.
The bears see the bull trend as weak, like a leg in a trading range. The scale in bears have limit orders to sell at the prior high and scale in higher. Because they think the rally will soon convert into a trading range, they expect a pullback that would allow them to get out breakeven on their 1st entry and with a small profit on the 2nd sell. They need the pullback to dip back below the old high. If the pullback does not dip far enough and the bull trend resumes, those bears will be trapped and will have to buy back with a loss.
All they see is what they mistakenly think is a weak rally. They do not see the signs of strength. They keep selling above every prior high and below every bear reversal bar because they correctly believe that a weak rally becomes a trading range 75% of the time. They incorrectly believe that the rally is weak. Those gaps and small, brief pullbacks tell astute traders that this is instead a Small Pullback Bull Trend, which is one of the strongest types of bull trends. Just look at a higher time frame, like the weekly chart. That series of weak bars on the daily chart is probably a series of strong bull trend bars on the weekly chart. The trend can go a long way. Read carefully what I said. This is a 25% bet and therefore probably will not happen. When it does, it can be spectacular in terms of how far up it does, looking as weak as it will look.
As I have been saying for over a month, the March rally will probably become a 100 point trading range that lasts at least a month. It has lasted almost a month, but its size will probably double due to a bear breakout at some point over the next month. A bull breakout is less likely.
Traders can see the end of the day bar-by-bar price action report by signing up for free at BrooksPriceAction.com. I talk about the detailed Emini price action real-time throughout the day in the BrooksPriceAction.com trading room, and a 2 day free trial is available.
When I mention time, it is USA Pacific Standard Time (the Emini day session opens at 6:30 am PST, and closes at 1:15 pm PST). You can read background information on the intraday market reports on the Intraday Market Update page.


Al,
Thank you for your analysis. I understand the commentary, and recognize some of the patterns. You bring it all together and it helps me to decide whether I want to be in the market or not.