Monthly S&P500 Emini futures candle chart: Futures trading strategy at a new high
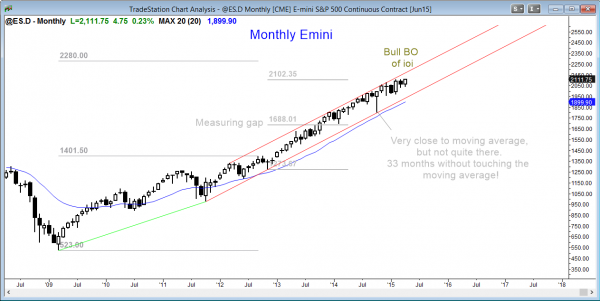
The monthly Emini futures candle chart had a bull breakout of the ioi pattern. There are 4 days left to the month, and the bulls want this month’s candle to be big so that traders will see the breakout as strong.
The monthly S&P500 Emini futures candle chart had a bull breakout above a bear ioi pattern this week. The bear bar lowers the probability of a big move up. The extremely overbought rally also limits the upside. Next Friday is May, and that will be the 35th consecutive month without a pullback to the moving average. The 1987 Crash came after 38 months. While the Emini futures market will almost certainly not crash, there is an 80% chance that it will pull back at least to the moving average this year. That is at least 200 points and 10%. I think that there is better than a 50% chance that it will test the October low and have closer to a 20% correction because the monthly chart is so overbought. The Emini futures market and all stock markets are filled with momentum traders. There are no value traders left. They are waiting to buy 10 – 20% lower. The momentum traders will exit quickly on any small reversal, and this could lead to a cascade of selling and a 10 – 20% correction.
So what is the futures trading strategy? It depends on your time frame. If you are looking to buy stock and hold it for a year or two, it makes sense to wait to by when the stock is on sale later this year. If you are a momentum trader, then you can continue to buy strength, betting on more strength. However, that trading strategy is only for traders who will manage their trades correctly once the reversal finally comes. Risk happens fast and it is easy to be in denial for that first week or two. This is not trading for beginners. By then, the Emini is already down 5 – 10% and you are wondering if the selling is over. You continue to hold and watch a 2nd leg down for a total of 10 – 20%.
Most reversals fail, so the probability is that any failed breakout on the monthly chart will fail. However, the probability is going up that one will succeed. If the bears are lucky, May will break strongly to the upside and then close on its low, creating a strong sell candlestick pattern. Will that happen? Probably not because great candlestick patterns are rare, and most reversals have one or two failures before one actually succeeds. The trading tip is to be ready for a reversal, and when it begins, do not be in denial.
Weekly S&P500 Emini futures candle chart: Small breakout above a 3 month tight trading range
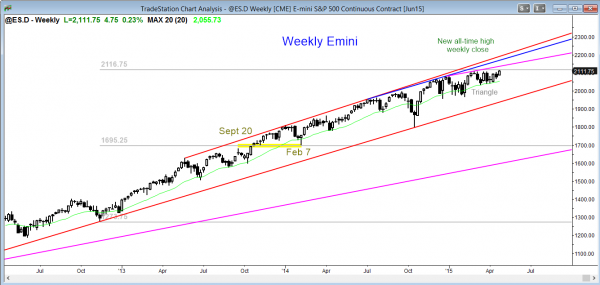
The weekly Emini futures candle chart broke above the tight trading range, but this week’s candlestick pattern is a small breakout bar. The bulls need follow-through buying next week, and the bears will try to reverse the breakout.
The weekly S&P500 Emini futures candle chart had a small breakout above a 3 month trading range. There is a trend channel line around 2130, which could be resistance. A reversal there would be a wedge top. Since most channel breakouts fail and reverse, a bull breakout above the channel will probably fail. The obvious target for the failure is a pullback into the 3 month trading range. Yes, there is a breakout, but when a tight trading range occurs after 20 or more bars in a trend, it is more likely to be the final bull flag than a launching pad for a new trend up. The price action trading strategy is to be ready for this bull breakout to fail and reverse down within about 5 bars (weeks).
Daily S&P500 Emini candle chart: Breakout to a new all-time high
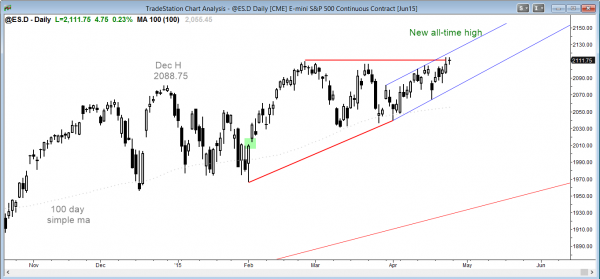
The daily Emini candle chart had a small breakout above the 3 month trading range.
The bulls need strong follow-through buying. Otherwise, this breakout will pull back below the breakout point, as have all of the other breakouts for over a year. This is expected in a broad bull channel. The bulls are hoping for a measured move up. Although this is possible, it is more likely that the breakout will fail and turn down before reaching the target.
Forex markets: Oversold and more trading range likely
The dollar had a strong bull trend against most other currencies, but the selling was climatic on the EURUSD monthly chart. When there is a sell climax, the stop for the bears is far away and the bears have to reduce their position size to control risk. When the bears buy, they create a pullback. They would not buy if they were looking to sell again on the next bar. Instead, they wait at least 5 – 10 bars to see if the bulls are able to create a strong reversal. The bulls usually are not. The bears then look to sell an ABC (low 2 bear flag) or wedge pullback. This would allow them to use a tighter stop and put their full position back on.
The bulls are hoping for a higher low major trend reversal on the daily chart. However, the bear channel was so tight that the reversal will probably result in only a big trading range on the daily chart and a pullback on the monthly chart (a bear flag).
Traders can see the end of the day bar-by-bar price action report by signing up for free at BrooksPriceAction.com. I talk about the detailed Emini price action real-time throughout the day in the BrooksPriceAction.com trading room, and a 2 day free trial is available.
When I mention time, it is USA Pacific Standard Time (the Emini day session opens at 6:30 am PST, and closes at 1:15 pm PST). You can read background information on the intraday market reports on the Intraday Market Update page.


Thanks a lot Al for the Forex update !.
Same as above, thanks for the FX update
Thanks Al for the Forex updates!! it’s been great reading them!!!
Thanks for the update on the EURUSD Al!
Thanks Al for the Forex update .