Monthly S&P500 Emini futures candlestick chart:
Strong bull trend, but buy climax
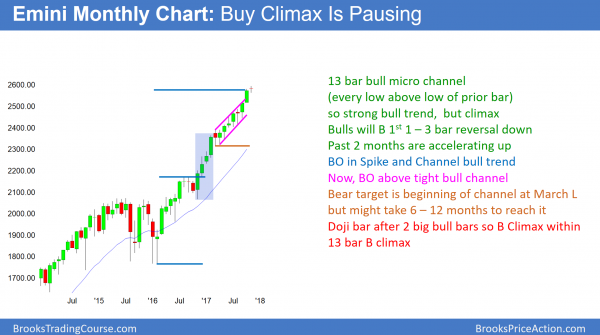
Every bar for the past 12 months has a low above the low of the prior month on the monthly S&P500 Emini futures candlestick chart. This is a 13 bar bull micro channel and therefore a strong bull trend. Since it is extreme, it is unsustainable and therefore climactic.
The monthly S&P500 Emini futures candlestick chart is in a 13 bar bull micro channel. This has happened only once in the S&P500 cash index in the past 70 years, and never in the 18 year history of the Emini. It is therefore extreme behavior. While it can get much more extreme, it will more likely return to more typical behavior. That means that a 1 – 3 month pullback will probably begin before year end.
Since the micro channel is a sign of very eager bulls, they will probably be eager to buy below the prior month’s low. Consequently, the downside risk is probably limited to a 1 – 3 bar (month) pullback. Since the bars are about 80 points tall, a pullback below a prior month’s low would be at least 80 points. A pullback will probably go more than 1 tick below the prior month’s low. Therefore, the pullback will probably be at least 100 points and about 5%.
Biggest buy climax in S&P500 cash index in 70 years
I mentioned that the S&P500 cash index had another 13 bar pullback in the past 70 years. It might be more than 70 years, but that is as far as I checked. That was in 1995 at the start of the biggest bull trend in my 30 year trading history. The pullback lasted one month and it was about 4%. Since the current micro channel is late in a bull trend and not at the start, the odds are that this pullback will be at least as deep. In addition, it will probably last a little longer. However, even if it is much deeper and longer, the bulls will buy it because the bull trend is so strong. This is true even if the Emini falls 20% over the next 6 months, which is unlikely.
Weekly S&P500 Emini futures candlestick chart:
Extreme buy climax
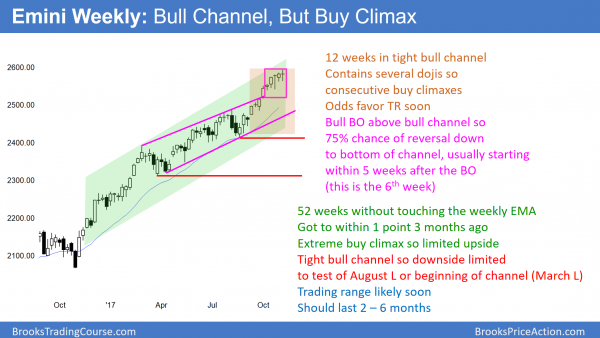
The weekly S&P500 Emini futures candlestick chart has been in a tight bull channel for 12 weeks. This is a strong bull trend. However, it has a series of bull bars separated by dojis. This is a consecutive buy climax pattern. In addition, the Emini has not touched its 20 week exponential moving average in 52 weeks. In a buy climax, every bar is a sell signal bar for the next week.
The S&P500 cash index was above its 20 week moving average for 62 weeks in 1995. That stretch was the longest in the past 70 years. The current streak is 52 weeks, and it is the 2nd longest in 70 years. The weekly Emini chart has never been this overbought in its 18 year history. While it got close to its 20 week EMA in August, it did not touch it.
Although the market never has to touch its average, it always eventually does. Therefore, the odds are that a pullback will begin soon. The politics surrounding either Trump’s tax reform including tax cuts or the budget vote could be the catalyst for a reversal. This is also the end of a great earnings season, and many bulls will take some profits before the end of the year. Yet, until there is a strong reversal down, the odds continue to favor at least slightly higher prices.
Daily S&P500 Emini futures candlestick chart:
Wedge top in buy climax
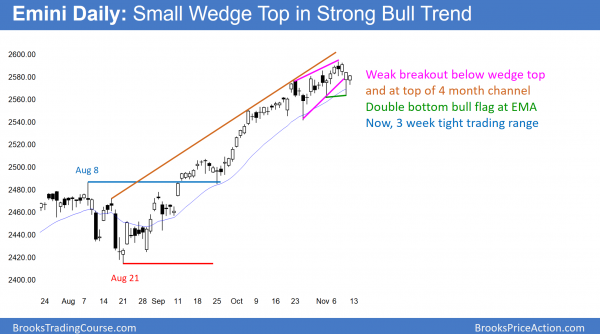
The daily S&P500 Emini futures candlestick chart broke below last week’s small wedge top. It is now in a 3 week tight trading range. Friday was a bull inside bar above the moving average. It is therefore a buy signal bar.
The bears have been selling new highs during this 3 week wedge rally. In addition, the bulls have been taking partial profits at new highs. With both the bulls and bears selling high, the odds are increasing that the bull trend is evolving into a trading range. However, if the bulls get a strong breakout above the high, they have a 40% chance of a quick measured move up.
Prior to the current rally, the daily S&P500 cash index has not gone more than 241 days without a 3% correction in 90 years. It has now gone 251 days. Like the weekly and monthly buy climaxes, this is extreme. However, until there are consecutive big bear bars, the odds are that the bulls will continue to buy every selloff. Yet, everyone knows how extreme the market is. As a result, once it begins to correct, the bulls will be very quick to get out. That increases the odds that the 5% correction could be very fast.
Traders can see the end of the day bar-by-bar price action report by signing up for free at BrooksPriceAction.com. I talk about the detailed Emini price action real-time throughout the day in the BrooksPriceAction.com trading room. We offer a 2 day free trial.
When I mention time, it is USA Pacific Standard Time (the Emini day session opens at 6:30 am PST, and closes at 1:15 pm PST). You can read background information on the intraday market reports on the Intraday Market Update page.


Hi Al,
I asked you about scale in earlier, and you mentioned that “I prefer not to scale in, but I often need to do it to make the math work out.”
I wonder if most of your scale in trades happen when you enter on a strong move, but then there is a deep pullback, and you would scale in after the initial movement resumes.
Thanks!
I scale in when I enter what is a reasonable trade, but room to support or resistance. For example, if I am buying either a pullback in a bull trend or what I think will soon be a reversal, but there are magnets (support below). If I think that the selloff might continue lower to that support, I will often scale in. However, if at any time I think my premise is wrong, I get out, whether or not I have scaled in.
There are many ways to scale in, and I talk about the ones that I use in the videos. Common choices are at buying more at a fixed number of points down, a 50% pullback, or after a reversal back up.
Thanks Al,
I now think that the most important thing when constructing a trade is that the stop is clear, that’s why I ask if you mostly scale in with always in direction, since the stop in that case is quite clear.
When scale in in a trading range, I think the difficult part for a developing trader is that the stop is not that obvious, and he might already have a big loss when realizing that his premise is wrong.
Just my opinion, thanks again.
Hey Al,
The lack of volatility in this market has been difficult for me. I’m making money, but not “enough money”.
I want to scale up my trading by increasing my number of trades, rather than increasing size on the few trades that I’m making every month.
The smaller ranges make it difficult to increase my trade count — and I have a hard time buying them while they’re already up. So I’m left sitting on my hands on most of the days as I watch them slowly grind higher. I only scalp/swing from the long side 99% of the time. Profitably over the last year.
I guess no real question here.. but would just be curious on your thoughts — as well as hearing about any adjustments you have had to make in this low volatility market.
Thanks for all!
I always think it is better to trade than not to trade, even if a trader is not making much money. When a trader is consistently profitable, he is always deciding when to increase his position size. It simply comes down to comfort. Traders have to be comfortable with the amount they stand to lose, no matter what their position size is.
The market’s buy climaxes are the most extreme in history. This is not a good time to be making changes based on recent price action because this market is likely to change how it is behaving within the next couple of months. You can look at the VIX, which measures market volatility. It is rarely ever this low for this long. Consequently, it is likely to get quite a bit bigger soon. If a trader increases his size now, he will probably discover that his new size will soon be much too big.
Yes, I trade stocks. On a % basis, VXX will be one of the biggest movers. It is an ETF and it is similar to a leveraged upside down stock index. If you only want stocks and not ETFs, by definition, all of the high beta stocks will move the most. However, I don’t think of trading that way. I simply look for good patterns and then take the trade without worrying about whether some other stock will move more.
Al do you trade stocks ? If so what instrument would you think will move (long or short ) the most when scand p pullback starts ?