- Market Overview: Weekend Market Analysis
- 30 year Treasury Bond futures
- Bond futures weekly chart working down to bottom of 7-month range
- EURUSD Forex market
- EURUSD weekly chart will probably form lower high
- S&P500 Emini futures
- Monthly Emini chart has ioi Breakout Mode pattern
- Weekly S&P500 Emini futures chart has weak High 1 buy signal and there is resistance at the September high
- Daily S&P500 Emini futures chart turning up from a wedge bull flag but near top of 2-month trading range
Market Overview: Weekend Market Analysis
The SP500 Emini futures reversed up this week on the daily chart from a wedge bull flag reversal and a test of the September 16 top of a month-long trading range. It could rally for a couple weeks, but traders think it will probably reverse down again before breaking much above the all-time high.
The weekly Bond futures market has been selling off for 3 months on the weekly chart, but it is getting near the bottom of its 7-month trading range.
The EURUSD Forex market has had a weak rally for 4 weeks on the weekly chart. It will probably form a lower high soon and have a 2nd leg sideways to down.
30 year Treasury Bond futures
Bond futures weekly chart working down to bottom of 7-month range
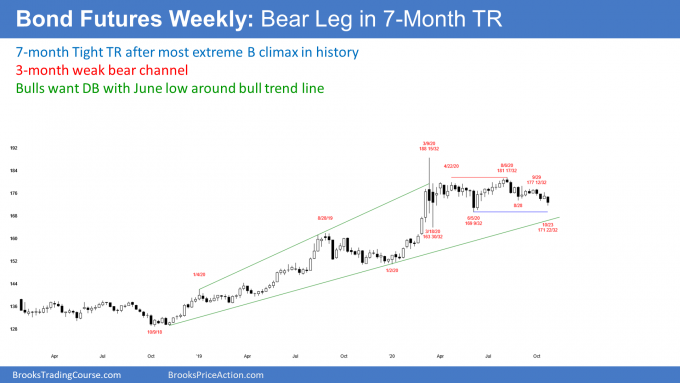
The weekly bond futures have been trending down since early August. This week was a big bear bar closing near its low. Furthermore, this week closed below the low of a 4-month trading range. It is still in its 7-month trading range, but this week might be the start of a move down to the June low.
Next week is important. It is the follow-through bar and it help traders decide if this week’s breakout will lead to a measured move down or a reversal up. If next week is a big bull bar closing near its high, traders will conclude that the breakout failed. They will then look for a rally back to the middle of the 7-month trading range over the next few weeks.
But if next week is a 2nd consecutive big bear bar closing near its low, traders will see it as confirmation of this week’s breakout. That would increase the chance that there will be at least 2 legs down and that the selloff will test the June low.
Expect unclear follow-through next week
What is most likely next week? Neither. The chart is in a trading range. Traders should expect disappointing follow-through. That means that a big bear bar is not as likely as traders might think.
Can it be a big bull bar? Probably not. Trading ranges usually do not create many strong buy or sell signal bars.
Next week might have a bull or bear body, but it will probably have a tail on the top or bottom to weaken the strength of the signal. It would then have something for everyone. Not too bearish, not too bullish.
Unless it is a bull bar closing in the upper half, traders will expect at least sideways to down trading over the next couple weeks. The more bullish the bar is, the more likely the bonds will go sideways to up. The more bearish, the more likely it will go sideways to down.
It probably will not collapse. However, I have been saying that the bull trend in bonds will probably not continue much longer. In addition, I have repeatedly said bonds will be lower 5 years from now and 10 years from now. Interest rates will not hit zero, as so many “experts” have predicted. That means the upside is limited. The bulls will be lucky if the bond market tests the March high.
The Fed is lying
What about the Fed keeping rates low? Two thoughts. First, they only control short-term rates and not the bond market.
Second, they lie. The Fed has said that it will keep short-term rates as low as necessary to protect the economy, which means the stock market. But read its statement carefully. It is not absolute.
Everyone counting on the Fed will probably see the Fed change its policy sooner than when they said they would. If bonds sell off, long-term rates will go up. That means inflation. The Fed would be forced to raise rates if they were concerned that inflation was rising too fast.
That is more likely than not. Expect the Fed to raise rates sooner than what they have led the public to believe.
EURUSD Forex market
EURUSD weekly chart will probably form lower high
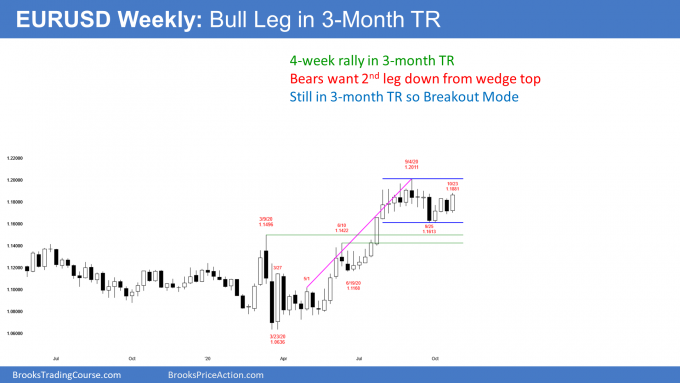
The EURUSD weekly chart rallied this week but barely got above last week’s high. The bulls hope that the summer rally is resuming. However, the bears see the 4-week rally as a pullback from a 1st leg down from a wedge top. They expect a 2nd leg sideways to down.
Last week pulled back after 2 strong bull weeks. It was therefore a High 1 bull flag buy signal bar for this week. But it had a bear body and its high was in the middle of a 3-month trading range. I said that this was a weak buy signal and that there might be more sellers than buyers above last week’s high. This week closed just above last week’s high. There may be more sellers here. Traders will find out next week. It next week rallies, the EURUSD will probably test the September high soon. If next week is a bear bar, then there were more sellers above last week’s high.
Trading ranges resist breaking out
Where does this leave traders? Confused. And confusion is one of the hallmarks of a trading range. Therefore, traders believe that the 3-month trading range is still in effect.
While it is clearly possible that the bull trend is in fact resuming, it is more likely that the September 1 wedge top is still controlling the market. A wedge top is a buy climax. After a buy climax, traders usually expect a couple legs sideways to down.
So far, there has only been one leg down. Consequently, traders expect the 4-week rally to stall and for the EURUSD to have a 2nd leg sideways to down. It should begin within the next few weeks.
What happens if the rally breaks above the September high? If the bulls get 2 closes above that high, there will probably be a 400-pip measured move up to the February 2018 high at around 1.25.
But if the breakout reverses down within a couple weeks, that could still be the start of a 2nd leg sideways to down from the September 1, 2020 wedge top.
Sometimes a sideways pullback in a bull trend has a leg that goes above the high of the bull trend. Since a lower high is more common, that’s what traders expect. But if there is a breakout above the September high and it soon reverses down, the 2nd leg from the wedge would come from a higher high.
S&P500 Emini futures
Monthly Emini chart has ioi Breakout Mode pattern
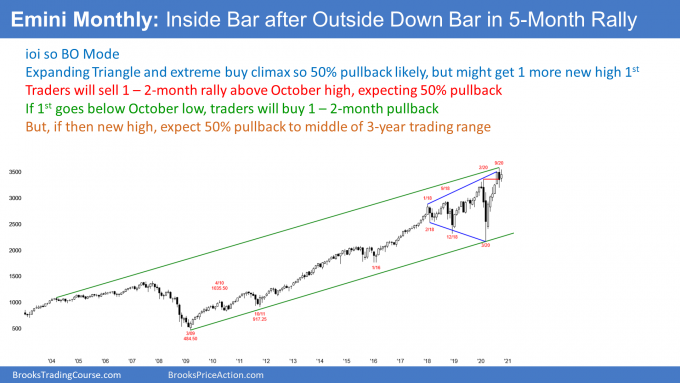
The monthly S&P500 Emini futures chart has an inside bar so far in October. This is after last month being an outside bar. This is an ioi (inside-outside-inside) setup, which is a Breakout Mode pattern. October is therefore both a buy and sell signal bar for November.
There are 5 trading days remaining in October. October’s candlestick could look very different when the month ends.
If October closes on its high or breaks above the September high, traders will expect higher prices in November. If it closes near its low or breaks below the September low, November will probably trade lower.
Limited up or down for next couple months
But what happens if October remains an inside bar and has either a small bull or bear body? Then, traders will see it as neutral. The chance of an upside breakout would be about the same as for a downside breakout.
Since the 5-month rally was extreme and therefore a buy climax, and it stalled at the top of the expanding triangle, traders believe that a rally from here would only last a month or two before reversing.
But a buy climax means strong bulls. Therefore, traders also believe that a selloff from here will only last a month or two.
If the Emini probably won’t go far up or down, it will go sideways. If it goes down, it could get back to the middle of the 3-years trading range. That would would be just below 2900.
Weekly S&P500 Emini futures chart has weak High 1 buy signal and there is resistance at the September high
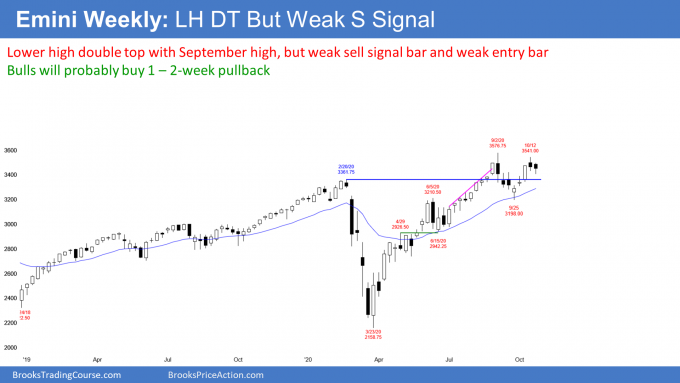
The S&P500 Emini futures triggered a minor sell signal on the weekly chart this week. Last week reversed down from a lower high double top with the September 2 all-time high.
However, last week did not close on its low and was therefore a weak sell signal bar. Furthermore, it followed a strong 3-week rally. That made a major trend reversal unlikely.
I said that this week would probably trade below last week’s low to trigger the sell signal but the selloff should only last a week or two. That is still the case.
Even though this week was a bear bar, it is probably forming a bull flag which could last another week or so. Traders expect at least one more push up. But because this week had a bear body and there are consecutive bear bars, it is a weak High 1 bull flag buy signal bar for this week.
Weak buy and sell signals
A weak sell signal last week, a weak buy signal this week… what’s going on? Traders expect a selloff, and it might retrace half of the 5-month rally. A 50% correction would be below 2900.
But the 3-week rally was strong and there is room to the all-time high. Therefore, traders think that the bulls will make one more attempt to break far above the all-time high. Attempt, not successful attempt.
Traders believe that if there is a rally, it will only last a week or two. The Emini is at the top of a 3-month trading range. It is more likely to reverse down than break strongly above. But there is no clear top yet and therefore the Emini might rally a little more before reversing down.
Daily S&P500 Emini futures chart turning up from a wedge bull flag but near top of 2-month trading range
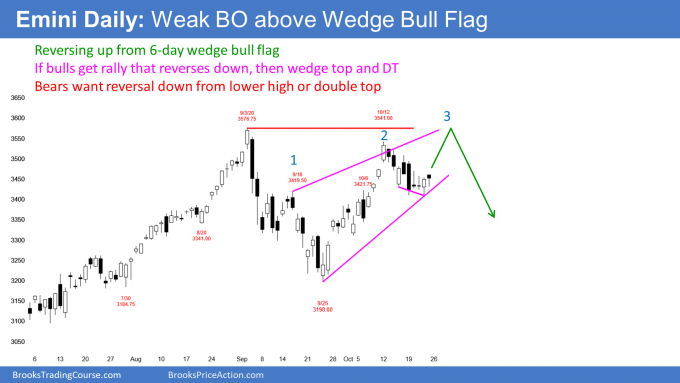
Two weeks ago, the daily S&P500 Emini futures chart broke strongly above the September 16/October 6 double top. It reversed down over the past 2 weeks. The Emini reversed up on Thursday from a 6-day micro wedge bull flag. The bulls want the bull trend that began on September 24 to resume.
I wrote last week that the selloff would probably end this week and that the Emini would test the October 12 lower high. I said that if it goes above that high and reverses down, there would be a wedge rally where the 1st leg up was the September 16 high and the 2nd was the October 12 high.
That reversal would also be a double top with the September 2 all-time high. A wedge rally to a double top is a strong sell setup. Since great reversal patterns are rare, if there is a reversal down in the next several weeks, the setup will probably not be particularly clear. Why? Because most trends, especially tops, begin with setups that are not perfect.
Is the past 2 weeks the start of a bear trend?
The bears hope that the 2-week selloff is the start of a bear trend. They see the October rally as forming a lower high double top with the September all-time high. They want the selloff to continue down to below the September 24 low.
That is the neckline of the double top. A measured move down would be 2819.25. That is also about a 50% retracement of the 5-month rally, and it is a test of the June trading range, which is a possible Final Bull Flag.
While this is possible, the rally 2 weeks ago was especially strong. Therefore, it is more likely that the Emini will make one more attempt to break to a new high before a bear trend begins.
How likely is a reversal down?
The Emini is near the top of a 3-month trading range. There is a 60% chance of a reversal down to at least the middle of the range, before the Emini breaks far above the September high. Also, there is a 50% chance that the selloff will reach the September low within a couple months, which is the bottom of the range. Finally, there is a 40% chance of a strong break below the September low, which could reach the targets below 2900.
How is that possible when the Fed said it will print infinite money to protect the economy, which means the stock market? Well, read the “The Fed is Lying” section under bond futures above. Once people begin to realize it, they will sell.
Every tick provides new information. These numbers are based on what the Emini is doing as of this week’s close.
Trading Room
Traders can see the end of the day bar-by-bar price action report by signing up for free at BrooksPriceAction.com. I talk about the detailed Emini price action real-time throughout the day in the BrooksPriceAction.com trading room. We offer a 2 day free trial.
Charts use Pacific Standard Time
When I mention time, it is USA Pacific Standard Time (the Emini day session opens at 6:30 am PST, and closes at 1:15 pm PST). You can read background information on the intraday market reports on the Market Update page.

