Market Overview: S&P 500 Emini Futures
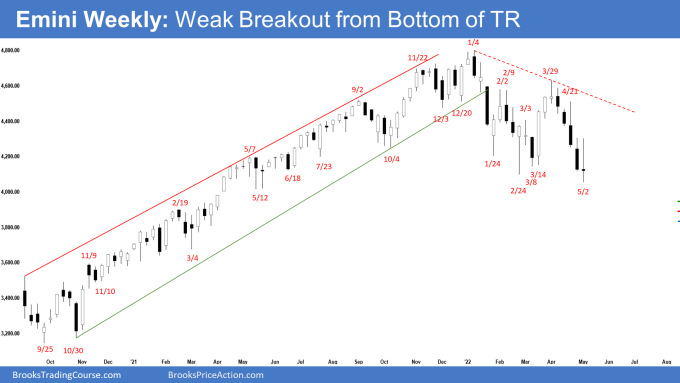
The S&P 500 Emini futures had a weak breakout below trading range and February low. Bears hope this is simply a breakout pullback and want a strong breakout and a measured move down. Bulls want a reversal higher from the bottom of the 9-month trading range. They see a wedge bull flag and a lower low major trend reversal setup.
However, the sell-off from March 29 has been strong. Odds are, a pullback (bounce) from here would be minor and traders expect at least a small second leg sideways to down after a slightly larger pullback.
S&P500 Emini futures
The Weekly S&P 500 Emini chart

- This week’s Emini candlestick was a bear doji bar closing above February low and slightly above last week’s low. It was a trading range week.
- Last week, we said that odds favor at least slightly lower prices and a breakout attempt below the 9-month trading range low.
- Traders will be monitoring whether the bears get another bear bar closing below the February low or if the Emini trades lower, but reverses to close as a bull reversal bar.
- This week, the Emini traded lower and broke below the 9-month trading range low, but the bears were not able to get follow-through selling below it.
- Bears want a strong break below the February 24 low which is the neckline of the double top bear flag and a measured move down towards 3600 based on the height of the 9-month trading range.
- The bears hope that this week was simply a pullback and want at least a small second sideways to down leg after a pullback.
- This week was a doji bar, it is not a strong sell signal bar for a strong breakout below a trading range.
- The bulls hope that the sell-off in the last 5 weeks was simply a sell vacuum to test the February low.
- They see a wedge bull flag (Jan 24, Feb 24, and May 2) and want a reversal higher from a lower low major trend reversal and wedge bull flag.
- However, the selloff from March 29 has been very strong. The bulls will need at least a micro double bottom or a strong reversal bar before they would be willing to buy aggressively.
- Since this week was a doji bar following 4 strong bear bars, it is not a good setup for a strong reversal up.
- Traders need more information, therefore more bars. The Emini may have to go sideways for another week or two before traders decide whether the Emini should break below the 9-month trading range low or reverse higher.
- Al has said that the Emini has been oscillating around 4,400 for 9-months. That price might well end up being the middle of the trading range. Since the top of the range is about 400 points higher, the bottom could be 400 points lower. That is below the February low and around the 4,000 Big Round Number.
- If it gets there, traders will then wonder if the Emini might fall for a measured move down from the February/March double top. That would fill the gap above the March 2021 high on the monthly chart.
- The Emini is currently trading at the bottom of the 9-month trading range. Trading ranges tend to disappoint both the bulls & bears and have poor follow-through. Traders will BLSH (Buy Low Sell High) and scalp.
- We have said that the bears got consecutive big bear bars closing near the low. It increases the chance of a downside breakout attempt. This remains true.
- The Emini may need to trade sideways to up for another week or two before traders are willing to bet aggressively on a breakout below or a reversal higher.
- The channel down from March 29 has been strong with consecutive bear bars closing near the low. Odds favor at least a small second leg sideways to down move after a pullback (bounce).
The Daily S&P 500 Emini chart

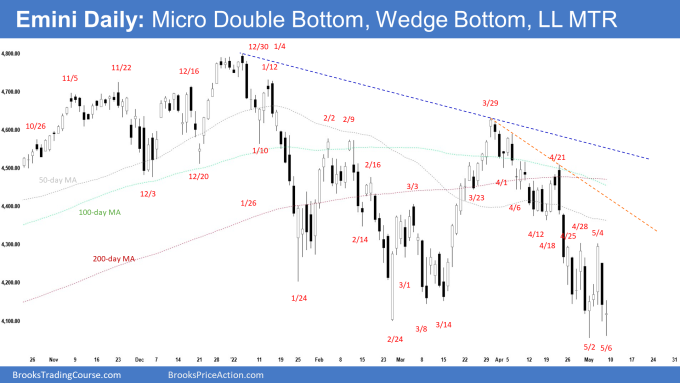
- The Emini traded below February 24 low on Monday but reversed to close as a bull reversal bar. The Emini then pulled back higher to test last week’s high followed by a strong reversal to re-test the low on Thursday and Friday.
- Previously, we said that traders will be monitoring whether this is a sell vacuum test of the February low, and buyers appear below, or if the bears continue to get strong consecutive bear bars and a breakout below February low.
- This week, the Emini tested below the February low, but the bears have not been able to create consecutive bear bars closing far below it.
- The bulls want a reversal higher from a wedge bull flag (Jan 24, Feb 24, and May 2) and a lower low major trend reversal. They also have a micro double bottom (May 2 and May 6).
- Friday closed as a bull doji above the middle of the bar with a prominent tail above and below. It is not a strong buy signal bar for Monday.
- The bears want a strong break below February 24 low and a measured move down to around 3600 based on the height of the 9-month trading range.
- The channel down from March 29 to May 2 has been tight. That means strong bears. Traders expect at least a small second leg sideways to down after a pullback (bounce).
- The pullback midweek and re-test of the low by Friday fulfilled the minimum requirement of a second leg sideways to down.
- There were 2 attempts to break below the February low (Monday and Friday) but both times reversed back higher to close above it. The bears are not as strong as they could have been.
- We have been saying that the rally from the March 14 low to March 29 high was likely a bull leg within a trading range, and not the start of the bull trend.
- Similarly, as strong as the sell-off from March 29 is, odds are it is a bear leg within the trading range, not the start of the bear trend.
- We will likely see traders BLSH (Buy Low Sell High) at the extremes of the trading range. This remains true.
- Again, Al said that the Emini has been oscillating around 4,400 for 9 months. That price might well end up being the middle of the trading range. Since the top of the range is about 400 points higher, the bottom could be 400 points lower. That is below the February low and around the 4,000 Big Round Number.
- If it gets there, traders will then wonder if the Emini might fall for a measured move down from the February/March double top. That would fill the gap above the March 2021 high on the monthly chart.
- Friday was a weak buy signal bar. The bulls will trigger the high 2 buy signal by trading above it.
- The bulls will need to create consecutive bull bars closing near the high to convince traders that a reversal higher from the bottom of the trading range is underway.
- The bear trend line and the 50-day, 100-day and 200-day moving averages are resistances above.
- The channel down since March 29 has been tight. Odds are the pullback (bounce) will be minor and the bears will get another sideways to down leg after a larger pullback.
Trading room
Traders can see the end of the day bar-by-bar price action report by signing up for free at BrooksPriceAction.com. Al talks about the detailed Emini price action real-time throughout the day in the BrooksPriceAction.com trading room. We offer a 2 day free trial.
Market analysis reports archive
You can access all weekend reports on the Market Analysis page.


Thanks for the report Andrew! Very insightful. Could you kindly shed some light on a few observations of mine, if it’s not asking too much –
1. I can see a wedge forming using 4th October 2021/3rd December 2021, January 24 and February 24/March 14 lows in addition to the wedge you mentioned. I suppose that makes a nested wedge pattern?
2. Then again, I am also seeing a LL MTR sell signal on 29th March as well. Also, that the LL MTR is following a very tight bull channel.
Any breakout attempt below the wedge would also face support from the 4000 BRN.
Is it a possibility that a low will be placed around the supposed 4000 BRN and the market will make new high converting itself into a broad bull channel and not a TR?
I realise, I am seeing both good bull and bear setups and that means we’re probably in a TR but I was hoping you would weigh in on the observations and share some insights into it.
Hopefully this large comment is worth your time. Have a blessed week ahead!
Dear Abir,
Thanks for looking at the report..
For question 1)
Do you mean the leg down from March 29 to May 2 low has a wedge too, therefore an embedded wedge?
It does..
For question 2)
Yes, March 29 could have been seen either as a:
a. Double top bear flag or
b. Lower High Major Trend Reversal
Both are correct..
My personal views:
The selling pressure has been strong, but the breakout still weak.
Perhaps we may get another bounce and a test of the resistance above, get another lower high, and the bears will try sell again above?
If we get another bounce, but it stalls at resistance above, it would be a wedge bear flag setup..
Have a blessed week ahead!
Best Regards,
Andrew
Thanks for looking into my comment and sharing your view. I’m assuming you’ve ruled out a new high because of the strong selling pressure.
Guess that makes sense. Thanks again.
Dear Abir,
A new high probably late in the year or next year?
Hard to tell at the moment.. sentiments are quite bearish with the Fed hiking rates, China lockdown, war in Ukraine, etc..
Selling pressure is definitely stronger than people expected in the last 1-2 weeks..
Monitor day-to-day, week-to-week and see how it plays out.. situation can change at a moment’s notice..
Alright, be well and have a blessed week ahead!
Best Regards,
Andrew