Monthly S&P500 Emini futures candlestick chart:
Extremely strong bull trend
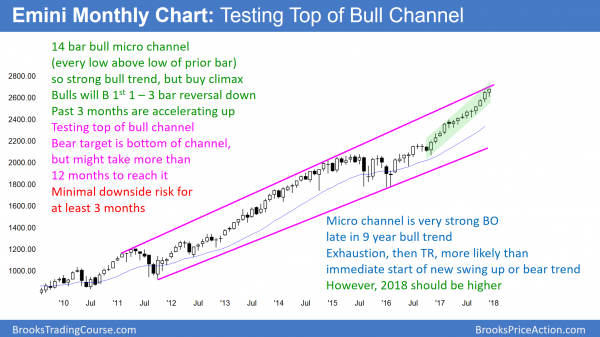
So far, this month’s S&P500 Emini futures candlestick chart has a bull bar. Its low is above last month’s low. It is therefore the 13th consecutive month without a pullback. In addition, it is at the top of a 9 year bull channel.
The monthly S&P500 cash index’s candlestick chart currently has its 1st 14 bar bull micro channel since the index was created in 1923. While a chart never has to have a pullback, one always eventually comes. Because this is beyond what the stock market has ever done, there is a 70% chance of a pullback within the next few months.
A pullback simply means that a month trades below the low of the prior month. Because the bulls have been so eager to buy that they have not been waiting for a pullback, they will eagerly buy one when they get a chance. Consequently, the odds are that the 1st pullback will only last 1 – 3 months. The bull trend will then resume.
Since the bars on the monthly chart are about 70 points tall, the 1st pullback will likely be at least 70 points. It probably will be around 100 points. This would create a 3 – 5% correction.
A 14 bar bull micro channel is extreme and therefore climactic and unsustainable. As a result, the trend resumption up from the pullback might only last a few bars before there is another pullback. That means that the odds are that the bull trend will begin to enter a trading range over the next 10 bars. Ten bars is about a year.
Sideways to up in 2018
Since the rally is so strong, the odds favor mostly sideways to up next year. However, there probably will be at least 2 – 3 pullbacks that last 1 – 3 months.
When a bull trend is this strong, there is only a 20% chance that the 1st pullback grow into a bear trend. The bears will need at least a micro double top or 3 consecutive bear bars before traders begin to believe that the bears are creating a bear trend.
Weekly S&P500 Emini futures candlestick chart:
Weak follow-through after November bull breakout
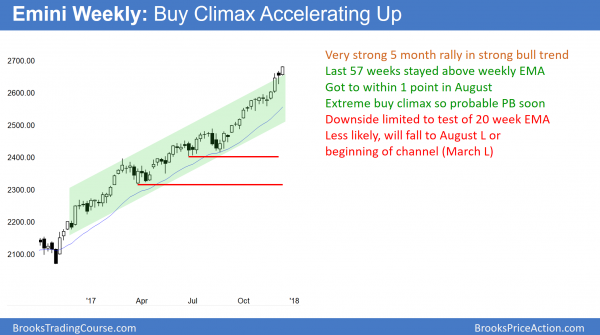
The weekly S&P500 Emini futures candlestick chart had a bull trend bar this week after last week’s bear doji. This is follow-through buying after a strong breakout above a tight bull channel 3 weeks ago. It is also the 57th consecutive week without touching the 20 week exponential moving average.
The weekly S&P500 Emini futures candlestick chart has not touched its 20 week EMA in 57 weeks. The longest streak in the history of the S&P cash index was 62 weeks, and that was in 1995. The next longest was only about 40 weeks. This rally is therefore extreme. Consequently, the odds are that the Emini will begin to pull back within the next couple of months.
The EMA is more than 100 points below. The pullback will probably fall 20 – 50 points below the average. As a result, when the pullback comes, it will probably be more than 100 points from the high. This would be about a 5% correction.
The yearlong bull channel is tight. The bull trend is therefore strong. There is only a 20% chance that a strong bull trend will reverse into a bear trend without 1st forming a trading range or a major trend reversal. Therefore, the downside risk over the next several months is small.
What happens if there is a trading range?
Even though a trading range is more likely than a bear trend, the trading range can be tall. For example, if the 1st leg down falls below the August high, the selloff could be about 10%. Yet, the odds are that it would be a bear leg in a trading range and not the start of a bear trend. Once there was then a bull leg in the range, the bears would try to form a lower high major trend reversal.
A major reversal down needs strong selling pressure. This usually means that the 1st leg down has to last 10 or more bars. In addition, the rally back up is usually about 10 or more bars. This means that the bears will likely need 20 or more bars before they can create a reliable top. Hence, the best they can probably get over the next 6 months is a trading range. Consequently, the bulls will buy selloffs, even if they are strong, and even if one falls about 10%.
Daily S&P500 Emini futures candlestick chart:
Emini Trump rally awaiting Christmas tax cut vote
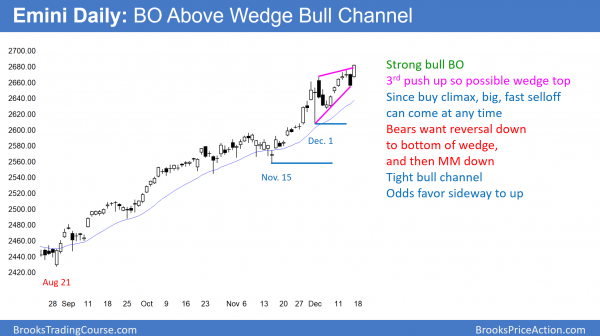
The daily S&P500 Emini futures candlestick rallied strongly this week. This is the 3rd push up since the December low so a reversal next week would form a wedge top.
The daily S&P500 Emini futures candlestick chart rallied strongly this week. However, it has not had a 3% correction in 275 trading days and 409 calendar days. That is the longest streak by far in the history of the stock market.
Charts map out rational human behavior. Consequently, moves that are far beyond past behavior always end before long. This means that the Emini will soon begin a 3% pullback. Because the target for the bears on the weekly chart is more than 100 points down, the odds are that the correction will probably be closer to 5%. While it could be more, the bulls will probably be eager to buy below the prior month’s low and around the 20 week EMA. Therefore, the first leg down will probably be about 5%, and not 10 – 20%.
What will the top look like?
The bears have have many credible sell setups this year. If the Emini reverses down next week, it will create a 3 week wedge top. However, my 80% rule says that 80% of trend reversal attempts fail. Therefore, betting that any one top is the final top is a low probability bet. The bulls have bought every reversal all year, and each became a bull flag.
Since the Emini has never been this overbought, there is a 70% chance of a 3 – 5% correction starting within the next couple of months. Therefore, one of these tops finally will work. However, until there are at least 2 consecutive big bear bars, traders will assume that any reversal down will be like all of the others. The bulls will buy it and the Emini will probably make a new all-time high.
Once there are 2 consecutive big bear bars, traders will begin to believe that a 5% correction has begun. But, 2 big bear bars could easily fall 60 or more points down from the high. This means that by the time traders believe that a correction might be underway, it will probably already be half over.
2018 test of August high
The September 25 pullback tested the breakout above the August 8 high. However, September 25 was a small doji that barely overlapped the breakout point. This is a weak foundation for a huge rally. Therefore, the odds are that it will have to get tested over the next 3 – 6 months. The means that the odds are that the Emini will eventually test down to below 2500 at some point in 2018. However, the monthly bull trend is strong. As bearish as a 200 point correction on the daily chart would be, it would still be a bull flag on the monthly chart. The odds are that 2018 will continue up, even if there is a 10% pullback at some point.
Traders can see the end of the day bar-by-bar price action report by signing up for free at BrooksPriceAction.com. I talk about the detailed Emini price action real-time throughout the day in the BrooksPriceAction.com trading room. We offer a 2 day free trial.
When I mention time, it is USA Pacific Standard Time (the Emini day session opens at 6:30 am PST, and closes at 1:15 pm PST). You can read background information on the intraday market reports on the Intraday Market Update page.


