Market Overview: S&P 500 Emini Futures
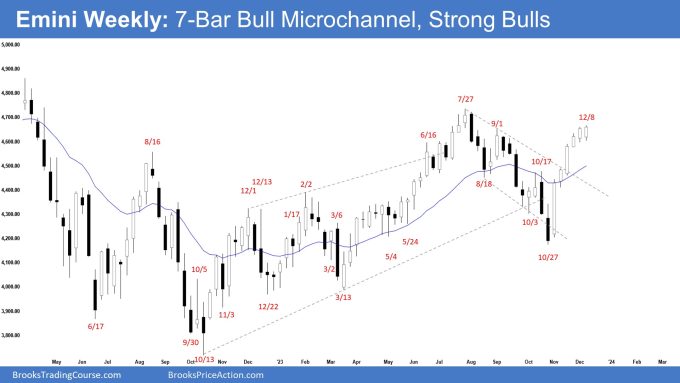
The weekly chart formed an Emini strong spike in the form of a 7-bar bull microchannel. The next target for the bulls is the July 27 high. The bears need to create strong bear bars with sustained follow-through selling to increase the odds of a deeper pullback.
S&P500 Emini futures
The Weekly S&P 500 Emini chart

- This week’s Emini candlestick was another consecutive bull bar closing near its high.
- Last week, we said that the odds continue to slightly favor the market to still be in the sideways to up phase. Traders will see if the bulls can get another follow-through bull bar or will the market trade slightly higher but close as a doji or with a bear body, beginning the minor pullback phase.
- This week opened lower but traded above last week’s high. It was mostly overlapping last week’s range.
- The bulls got a strong rally with consecutive bull bars breaking far above the 20-week EMA and the bear trend line.
- The move-up is in a 7-bar bull microchannel with bull bars closing near their highs. That means strong bulls.
- The next target for the bulls is the July 27 high, a logical area for protective stops for the bears.
- They hope to create a short covering spike above the July 27 high. Should it happen, bears that have covered will likely not sell again until another significant resistance above (probably above the all-time high next).
- If a pullback begins, the bulls want it to be sideways and shallow, with doji(s), overlapping bars and candlesticks with long tails below.
- If there is a deep pullback, they want a reversal up from a higher low major trend reversal and the 20-week EMA to act as support.
- The bears see the strong rally simply as a retest of the July 27 high.
- They hope that the strong move is simply a buy-vacuum test of what they believe to be a 36-month trading range high.
- They want a reversal from a lower high major trend reversal (with the July 27 high) or a double top with either the September 1 or July 27 high.
- The problem with the bear’s case is that the current rally is very strong.
- They will need to create strong bear bars with sustained follow-through selling to increase the odds of a deeper pullback. So far, they have not yet been able to do so.
- Since this week’s candlestick is a bull bar closing near its high, it is a buy signal bar for next week.
- The market may gap up on Monday. Small gaps usually close early.
- Odds continue to slightly favor the market to still be Always In Long.
- Odds also favor buyers below the first pullback from such a strong bull microchannel.
- If there is a deeper pullback, odds slightly favor at least a small second leg sideways to up.
- Traders will see if the bulls can get another follow-through bull bar or will the market continue to trade sideways, closing as a doji or with a bear body and a prominent tail above, beginning the minor pullback phase.
The Daily S&P 500 Emini chart

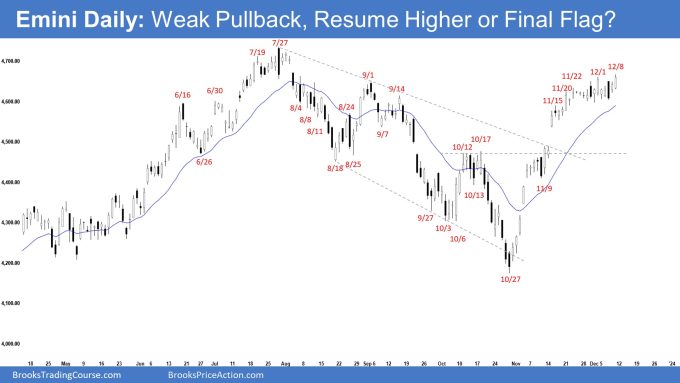
- The market opened lower and traded sideways to up for the week.
- Previously, we said that the buying pressure remains strong, and the odds continue to favor the market to still be Always In Long.
- The bulls got a reversal from a wedge bull flag (Aug 18, Oct 3, and Oct 27) and a trend channel line overshoot.
- The move-up is strong with several big gaps that remained open and in a tight bull channel.
- They hope that the current rally will form a spike and channel which will last for many months after a pullback.
- The next target for the bulls is the July 27 high, a logical area for protective stops for the bears.
- They want a strong short covering that will fuel the move higher.
- If a pullback begins, the bulls want the 20-day EMA to act as support and form a 20-Gap-Bar buy setup.
- The bears hope that the strong rally is simply a buy vacuum retest of the July 27 high.
- They want a strong reversal down, like the one in August 2022 following a similar strong rally.
- They want a reversal down from a lower high major trend reversal, a wedge top (Nov 22, Dec 1, and Dec 8) and a double top with the September 1 or July 27 high.
- The bears will need to create consecutive bear bars closing near their lows trading far below the 20-day EMA to increase the odds of a reversal.
- They hope that the tight trading range in the last 2 weeks will be the final flag of the move up.
- For now, the buying pressure remains very strong with bear bars not getting follow-through selling.
- Odds continue to favor the market to still be Always In Long.
- The pullback in the last 2 weeks is sideways and shallow which indicates persistent buying and weak selling pressure.
- The odds slightly favor any pullback to be minor followed by a retest of the current leg extreme high (now December 8).
Trading room
Al Brooks and other presenters talk about the detailed Emini price action real-time each day in the BrooksPriceAction.com trading room. We offer a 2 day free trial.
Market analysis reports archive
You can access all weekend reports on the Market Analysis page.


Thanks for the report Andrew, like the way you analyze and think what market can do. Just light adding: if you take the HSB composes from October 27th as the head and October 17th as the shoulder, you get a MM target that is slight above the July 27th high.
Dear Eli,
Thanks for your input as usual..
Let’s see how the market plays out this week..
Have a blessed week ahead..
Best Regards,
Andrew
Hello, why do you say 7 bars bull micro channel? There are 6 bull bars. Thank you.
It starts at the swing point, which is a bear bar. That is the first bar, therefore, a total of 7 bars without a lower low.
thank you, understood
Thanks Avi, have a blessed week ahead..
Best Regards,
Andrew
The cash S&P 500 traded above the July high on Friday.
Ola Andrew..
Yeah.. Cash SPX / SPY have traded above July high..
Let’s see how the market play out next week..
Best Regards,
Andrew
The last bull bar fully overlapped previous bull bar in the weekly chart. In small timeframe it could be TR. Saying that, it is a buy signal at what could be the top of a TR ?
Hi Leonardo,
You mean 2-bar trading range? or the multi-week/month trading range?
Best Regards,
Andrew
Sorry, I’ve just seen your response today.
Yes, I was referencing to the last 2 bull bars in the weekly chart that are overlapping. Thank you.
Yes, you can see that Weekly Trading Range clearly on the daily chart. There are several possible ways to look at it which include a Wedge top so if you want to buy up there it is better to wait for a stronger breakout of that Trading Range.
Thanks Andrew..
Dear Leonardo,
I had initially written it as a 1-bar trading range, because it was a trading range on the Daily Chart.
However on my final edit, I decided to remove that line because:
1) both candlesticks are Trend Bars closing near their highs
2) Last week also traded above prior week’s high
Had it been an inside doji, I would have likely left the line about it being a 1-bar trading range in the final report.
Hope this clarifies.
Have a blessed week ahead to both of you.
Best Regards,
Andrew