Market Overview: S&P 500 Emini Futures
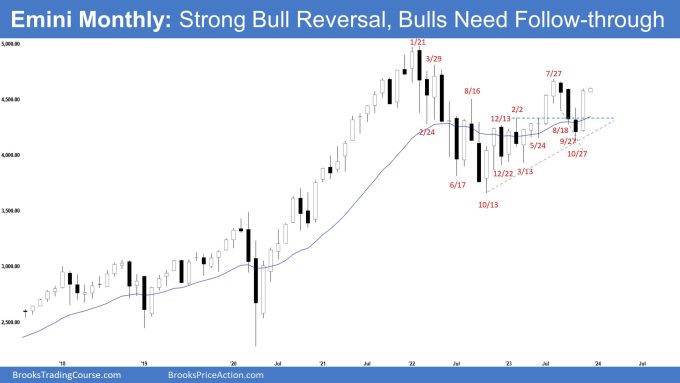
The market formed an Emini strong reversal on the Monthly chart, reversing the majority of the selloff of the prior 3 months. The next targets for the bulls are the July 27 high and the all-time high. The bears see the current rally as a retest of the July 27 high and want a reversal from a lower high major trend reversal or a double top.
S&P500 Emini futures
The Monthly Emini chart

- The November monthly Emini candlestick was a big bull bar closing near its high and above the October high.
- Last month, we said that the bull trend remains intact (higher highs, higher lows). If November closes as a bull bar near its high and above October’s high, that will increase the odds of the bull trend resuming.
- The bears see the current rally as a retest of the July 27 high and want a reversal from a lower high major trend reversal or a double top.
- They want a larger second leg down (with the first leg being the July to October pullback) and a retest of the October low.
- Because of the strong rally in November, they will need a strong signal bar before traders would be willing to sell more aggressively.
- Previously, the bulls managed to create a tight bull channel from March to July.
- That increases the odds of at least a small second leg sideways to up after the recent pullback (Jul to Oct). The second leg up is currently underway.
- They got a reversal from a trend channel line overshoot (Oct) and a higher low major trend reversal.
- They want a retest of the July 27 high and the all-time high followed by a breakout above.
- They hope that the current rally will lead to a multi-month rally, similar to the candlestick in November 2020.
- They will need to create a follow-through bull bar in December to increase the odds of the bull trend resuming.
- Since November is a big bull bar trading near its high, it is a buy signal bar for December.
- Odds slightly favor December to trade at least a little higher. The July 27 high is close enough and likely to be tested.
- If the bulls get a follow-through bull bar closing above the July 27 high, it will increase the odds of a retest of the all-time high.
- For now, the bull trend remains intact (higher highs, higher lows). This remains true.
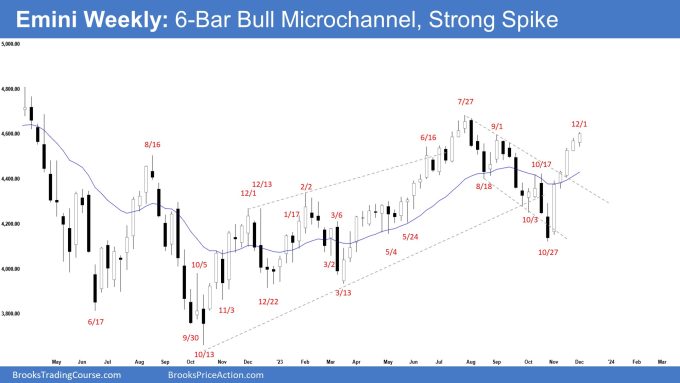
The Weekly S&P 500 Emini chart

- This week’s Emini candlestick was another consecutive bull bar closing near its high.
- Last week, we said that the odds continue to slightly favor the market to still be in the sideways to up phase. Traders will see if the bulls can get another follow-through bull bar or will the market trade slightly higher but close as a doji or with a bear body, beginning the minor pullback phase.
- Previously, the bulls got a reversal from a wedge bull flag (Aug 18, Oct 3, and Oct 27) and a trend channel line overshoot.
- They got a strong rally with consecutive bull bars breaking far above the 20-week EMA and the bear trend line.
- The move-up is in a 6-bar bull microchannel with bull bars closing near their highs. That means strong bulls.
- The next target for the bulls is the July 27 high, a logical area for protective stops for the bears.
- They hope to create a short covering spike above the July 27 high. Should it happen, bears that have covered will likely not sell again until another significant resistance above (probably above the all-time high next).
- If a pullback begins, the bulls want it to be sideways and shallow, with doji(s), overlapping bars and candlesticks with long tails below.
- If there is a deep pullback, they want a reversal up from a higher low major trend reversal and the 20-week EMA to act as support.
- The bears see the strong rally simply as a retest of the July 27 high.
- They hope that the strong move is simply a buy-vacuum test of what they believe to be a 36-month trading range high.
- They want a reversal from a lower high major trend reversal (with the July 27 high) or a double top with either the September 1 or July 27 high.
- The problem with the bear’s case is that the current rally is very strong.
- They will need to create strong bear bars with sustained follow-through selling to increase the odds of a deeper pullback.
- Since this week’s candlestick is a bull bar closing near its high, it is a buy signal bar for next week.
- Odds continue to slightly favor the market to still be in the sideways to up phase.
- Odds also favor buyers below the first pullback from such a strong bull microchannel. The first pullback likely will be minor.
- If there is a deeper pullback, odds slightly favor at least a small second leg sideways to up.
- Traders will see if the bulls can get another follow-through bull bar or will the market trade slightly higher but close as a doji or with a bear body, beginning the minor pullback phase.
Trading room
Al Brooks and other presenters talk about the detailed Emini price action real-time each day in the BrooksPriceAction.com trading room. We offer a 2 day free trial.
Market analysis reports archive
You can access all weekend reports on the Market Analysis page.


Thanks Andrew,
It’s always great to read your report every week!
As you’ve pointed out, the bull trend is intact in the higher timeframe with HHs and HLs.
How likely would you say that the market is in a trading range and the strong bull movement over the past weeks is “just” a bull leg in the trading range?
If this is the case, what would be the likely outcome for the following weeks?
Best regards,
Mario
Dear Mario,
Thank you for your continuous support..
Hmm.. good question..
I think this rally catching many by surprise is a sign that the move may be more than a buy vacuum test of TR high..
I remember seeing on twitter a couple of weeks back that institutional short was at record high for the year.. that can’t be good (for them) if the market continues up..
For now, the rally started with the big tech, and we have to see if it will broaden out to other sectors and small caps..
With last night major index SPX, DJI, Nasdaq down but Russel 2000 up, it does have signs of the rally broadening out..
Let’s continue to monitor week by week and analyze as we go..
Have a blessed week ahead..
Best Regards,
Andrew
To add on:
In terms of the chart, if it may be a trading range, we will start to see price stall possibly around the July 27 high area..
1) Followed by a pullback, and then
2) a second leg sideways to up,
3) which turns out to be weak, maybe 1-3 bars only, but end up as a lower high MTR,
4) followed by a strong spike down..
If the above happen, the odds of a trading range scenario will increase..
Hope this answers your question..
Have a blessed week ahead Mario!
Best Regards,
Andrew
Thx Andrew!!! Very insightful!
You’re most welcome Mario.. Be well!
Thanks Andrew always appreciate your insight.
Dear Gary,
You’re most welcome.. thanks for going through the report..
Have a blessed week ahead..
Best Regards,
Andrew
I think it’s way overextended and manipulated. I get it was oversold, but look at the premarket let’s say on SPY, there are many 0.2%-0.4% moves with absolutely zero volume. On these 0.4% moves, I trade more in a single week than these 0.4% manipulated moves. Someone is trying to increase price artificially. I’m not short or anything, even though I missed it to be honest, but I think some bulls might have a surprise very soon. Would you really invest or buy at these prices just because a bull bar closing on it’s high after 5 consecutives weeks? I thought the market was way more liquid than that. There’s clearly not enough liquidity on SP500/Nasdaq, otherwise these premarket moves wouldn’t have hold on live sessions. I can’t pull the trigger to get long without a pullback, I think it’s just stupid to buy at these prices. I prefer buying gold/miners than buying this market. You see the professional managers at CNBC say it will go to 5500 without any pullback (these people are plain idiots). A hard pass for me unless there’s a reasonable pullback. Thanks.
Dear Andrew,
Thanks for going through the report.
I totally understand what you are saying.. I’ve gone through the phase you are going through now..
Continue to learn and gain experience..
Have a blessed week ahead.
Best Regards,
Andrew