Market Overview: Weekend Market Update
The Emini has rallied strongly for 2 weeks. It might gap up again next week. Traders expect a new all-time high early next week, and they will buy the 1st 1 – 3 day pullback.
The bond futures market has rallied strongly for 9 weeks. However, it will probably begin to pull back for a week or two starting within a couple weeks.
The EURUSD Forex daily chart has a nested wedge buy climax. Traders should expect a 2 week pullback to begin soon.
30 year Treasury Bond futures
9 week rally will probably start to stall: Bulls need bull bar on the monthly chart
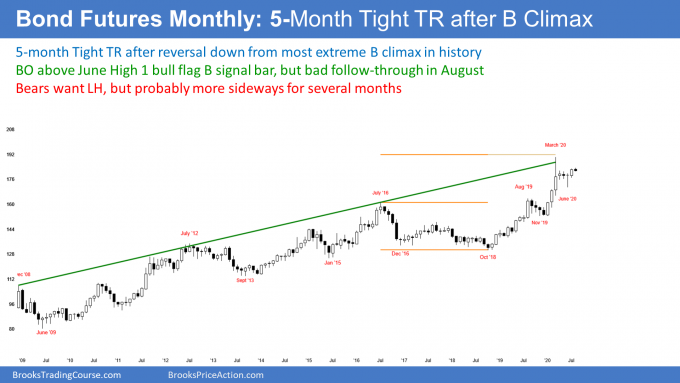
The tight bull channel on the weekly chart created a bull breakout in July on the monthly chart. August is the follow-through bar. Traders know that if August has a bull body, September will probably also go at least a little higher. But if August has even a small bear body, September will probably be sideways to down.
September is usually not a strong month in the stock and bond markets. Therefore, if September is to stall or pull back, August will probably have to close below the open of the month. That would require a 1 – 2 week pullback on the weekly chart.
Traders know that there is an increased chance of a bear bar on the monthly chart in August. They therefore expect the 9 week bull channel on the weekly chart to begin to turn sideways soon.
Weekly bond futures chart stalling at April high
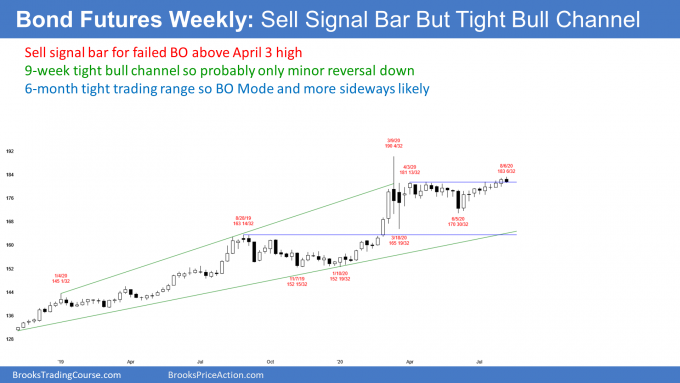
The 30 year Treasury bond futures weekly chart had another low above the prior week’s low. But the range was small. The bond futures are pausing around the April 22 lower high.
Traders are still not sure if the rally will break above the March high or form a lower high. But the weekly chart has been in a tight bull channel for 9 weeks. While the price is not racing up, that persistent buying reduces the chance of a sudden selloff.
With traders buying above the prior week’s low for such a long time, they will be eager to buy below the prior week’s low once they finally have the opportunity. Consequently, the 1st reversal down will probably only last a bar or two (a week or two). There should then be at least a brief second leg up. Therefore, most traders will not aggressively short until there is at least a micro double top, which will take at least a couple more weeks to form.
Bond futures have Small Pullback Bull Trend on the daily chart
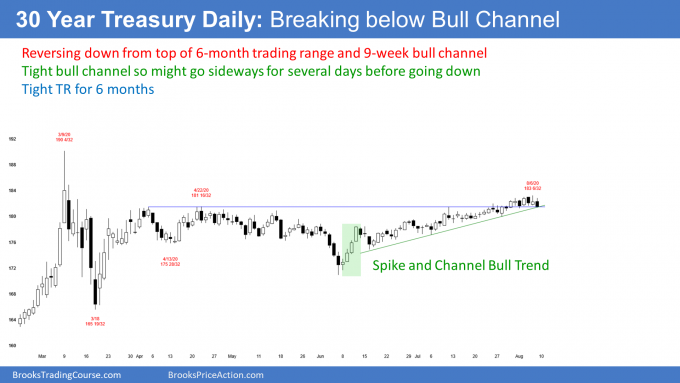
A micro channel on the weekly chart is always a Small Pullback Bull Trend on the daily chart. In this case, it is also the bull channel in a Spike and Channel bull trend. The 4 bull bars on the reversal up from the June 5 low formed the spike up. That was the bull reversal from the June sell climax.
Since the rally entered the channel phase with the June 16 pullback, traders have been buying every one to three day pullback. The result has been a tight bull channel (Small Pullback Bull Trend).
Some Small Pullback Bull Trends last 50 or more bars and accelerate up. Those that do typically have 2 or more sets of consecutive big bull bars closing near their highs. This rally lacks those strong breakouts. It is therefore more likely a bull leg in what will become a trading range.
Traders should expect a break below the bull trend line within a couple weeks. They then should look for a possible 2 – 3 week test down to around the June 16 start of the bull channel. This is consistent with the likely 2 – 3 weeks of sideways to down trading on the weekly chart. Also, it is consistent with the possible sideways move through September on the monthly chart.
EURUSD Forex charts
Stalling at the September 20 high, which was the start of the bear channel
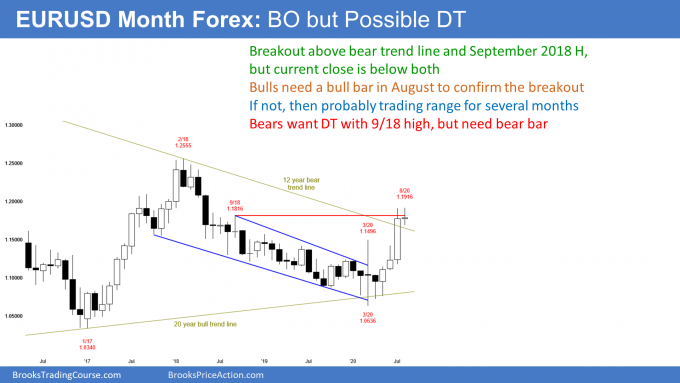
The EURUSD Bulls need bull bar in August
The EURUSD Forex monthly chart had a big bull bar in July that broke above the top of the 2 year bear channel. It also broke above the September 2018 high. That was the start of the bear channel, which followed the strong reversal down in April and May 2018 (the spike down in the 2 year Spike and Channel Bear Trend).
However, July closed below both resistance levels. Also, once there is a reversal up from a Spike and Channel Bear Trend, traders look for a test of the start of the channel (here, the September 2018 high) and then a transition into a trading range.
The bulls quickly retraced 2 years of selling. Traders are wondering if this strong reversal up will continue up to the February high. That was the start of the 30 month bear trend. While it is possible, that is not what typically happens. Usually the market stalls once it reaches the start of the bear channel. Since the EURUSD is there now, there is an increased chance of at least 2 – 3 weeks of sideways to down trading starting soon.
The EURUSD daily chart has a nested wedge buy climax
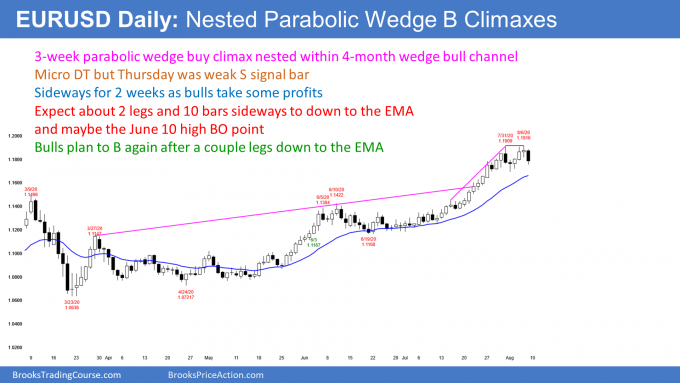
The daily chart rallied in a parabolic wedge buy climax over the past 3 weeks. That rally was the 3rd leg up of a bigger wedge bull channel that began in March.
There is now a micro double top. But Thursday was the sell signal bar and it was only a bull doji. That reduces the chance that a move down began on Friday. The daily chart might have to go sideways for a few days before it can go down.
A nested wedge is more likely to reverse. When a wedge reverses, there are several minimum goals. First, traders expect about ten bars and 2 legs sideways to down. Next, they expect a test of support, like the EMA and the breakout points. The rally broke above the March 9 and June 10 highs. Those breakout points are therefore magnets below.
Also, a wedge often reverses down to the bottom of the most recent leg up. That is either they July 16 or the June 19 low.
Finally, traders look for a retracement of a third to a half of the rally.
This all presupposes that the bulls are exhausted and will take profits starting within a week or two. That probably will happen, but with the rally as strong as it has been, there is a 40% chance that it will continue up to the February 2018 without more than a 2 – 3 week pullback.
Monthly S&P500 Emini futures chart
5th consecutive bull month and rare gap up
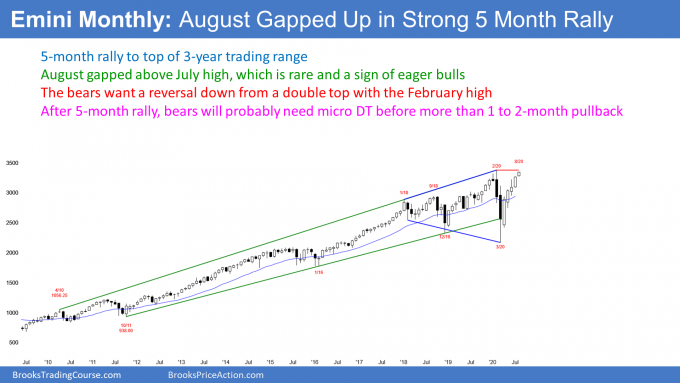
The monthly S&P500 Emini futures chart gapped up in August. Gaps on the monthly chart are rare. The gap was small and small gaps are typically not especially important.
August is forming its 5th consecutive bull bar since reversing up from a 10 year bull trend line in March. This is only the 1st week of August and the month could be very different once it closes. However, the momentum up has been good. Traders will probably buy the 1st 1 – 2 month pullback.
Will the Emini break strongly above the February high?
Can the bulls break far above the February high in August? Of course, but strong rallies usually have some profit taking around major resistance. The February high is an obvious possibility. But if August closes on the high of the month and far above the July high, traders will expect higher prices in September.
What happens if August reverses down and closes on its low? It would be a sell signal bar for September for a double top with the February high. However, after 4 strong months up, the 1st reversal down will probably be minor. Many bulls did not buy the rally and have been waiting for a pullback. That will probably limit the selling to a month or two.
After a pullback, will the Emini break far above the February high? It is more likely that a 1 month pullback will lead to a micro double top with the August high and at least another sideways month. At that point, traders will decide between a micro double top with the August high or a small bull flag and a resumption up of the bull trend.
Weekly S&P500 Emini futures chart
Accelerating up after gapping up this week
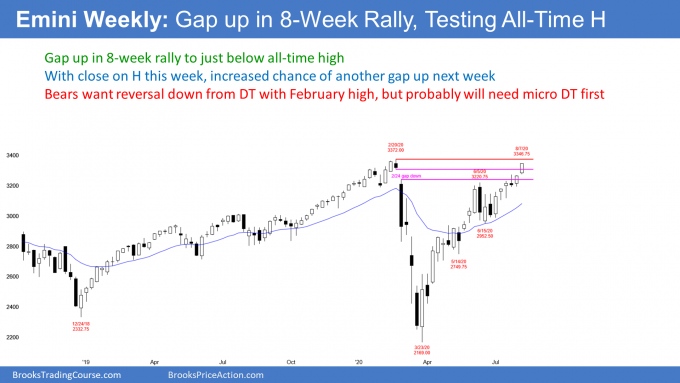
The weekly S&P500 Emini futures chart gapped up this week. Since there was a gap down in February, there is now a 4 month island bottom. The bulls are hoping that traders will see this as a sign of strength and encourage them to buy at the high.
Three of the past 5 weeks gapped up. The 1st 2 closed, but this week’s gap up stayed open. With this week closing on its high, there is an increased chance of a gap up again next week. There is a small chance of a gap above the February all-time high.
There is now a 6 week bull micro channel. That means the low of every bar was above the low of the prior bar for 5 weeks. That is an additional sign of strength and it further increases the chance of higher prices next week.
Also, even if next week pulls back, with this much momentum up, traders expect that buyers will soon come in. Consequently, even if there is a reversal down at the February high, the 1st attempt down will probably only last a week or two. The bears will likely need at least a micro double top before they can get a pullback lasting more than 2 weeks.
Daily S&P500 Emini futures chart
8 consecutive bull days unsustainable and therefore a buy climax
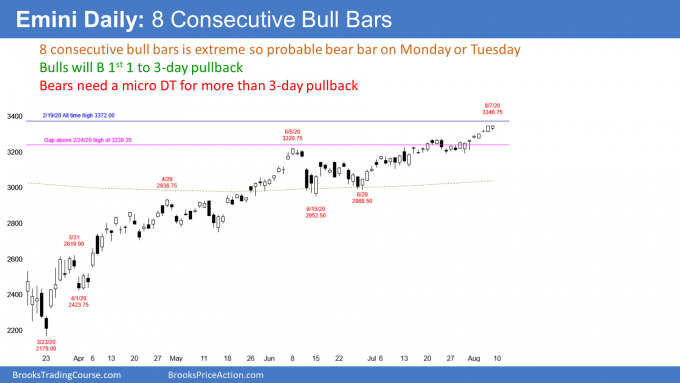
The daily S&P500 Emini futures chart has had 8 consecutive bull days. This is unusual and therefore unsustainable and climactic.
While this is a sign of strong bulls, a similar rally up to the June 5 high reversed down 9% over the next 5 days. However, the bears will probably need a micro double top before they can get more than a 1 to 3-day pullback. Traders expect a new all-time high next week.
When something is obvious, always be ready for the opposite
It is important to note that when there is a good chance of something bullish happening, the trade might be crowded. That means that everyone wanting to buy is already long and there is no one left to buy next week.
Consequently, whenever something seems likely, there is an increased chance of the opposite happening. For example, instead of rally strongly to a new high on Monday or Tuesday, the Emini might sell off sharply like it did in June.
Trading Room
Traders can see the end of the day bar-by-bar price action report by signing up for free at BrooksPriceAction.com. I talk about the detailed Emini price action real-time throughout the day in the BrooksPriceAction.com trading room. We offer a 2 day free trial.
Charts use Pacific Standard Time
When I mention time, it is USA Pacific Standard Time (the Emini day session opens at 6:30 am PST, and closes at 1:15 pm PST). You can read background information on the intraday market reports on the Market Update page.


The implied volatility of bond futures options is at the 18th percentile of the last 52 weeks with an expected move over the next 20 days of less than 2 points. Historical volatility of the futures is near an all time low. Makes a contrarian think.
It has been amazing for 9 weeks, but it could remain in a relatively tight range for the rest of the year with occasional 1 – 3 day traps up or down.
As you know, I think interest rates will go higher for the next 20 years, but they may not have hit their bottom yet. We still might get one more bond futures surge because everyone wants to know if the US rates can go negative.
I do not believe Americans would stand for it. But we still might get another dramatic bond rally to a new high and a final test of zero interest rates before bonds enter a bear trend.
If Congress can’t agree on a new stimulus program next week, will the emini tank, irrespective of the strong microchannel on the weekly chart? Do we then classify the price action response as a surprise bar, or just a random event bar? Isn’t random synonymous with surprise?
Finally, assuming a (huge) surprise bear bar occurs, does the preceding bull microchannel suggest buying the dip?
Thank you!
The market knows that the politicians will be forced to pass a bill in the next few weeks. If you are an incumbent, do you really want to enter an election with a huge failure? It’s not going to happen. The incumbents decide whether they will pass a bill, and since it is in all of their interests, they will.
But, if they do not pass a bill, the stock market will sell off. They will pass the bill, but it might sell off anyway because it is overbought, at the top of a 3 year trading range, and at a price where it sold off sharply in February. Traders therefore believe it can sell off at this level.
As I wrote, this rally is similar the the one that ended on June 5. The Emini sold off 9% in 5 days. In March, it sold off 35%. No one will be surprised by a 15% selloff coming at any time, whether there is good or bad news.
I use the term “Surprise Bar” as chart pattern, which can happen for any reason. I never worry about the news. All I care about is the market’s reaction. For example, with the worst GDP and unemployment since the Great Depression, shouldn’t the stock market be down 40%?
I do not believe anything is random. That is a term that I use to describe anything happening on a higher or lower time frame that I am not following. On my time frame, there is always a technical foundation for any move. Also, most surprises are triggered by at least a small news event.