Al added a few comments to report
Market Overview: Weekend Market Analysis
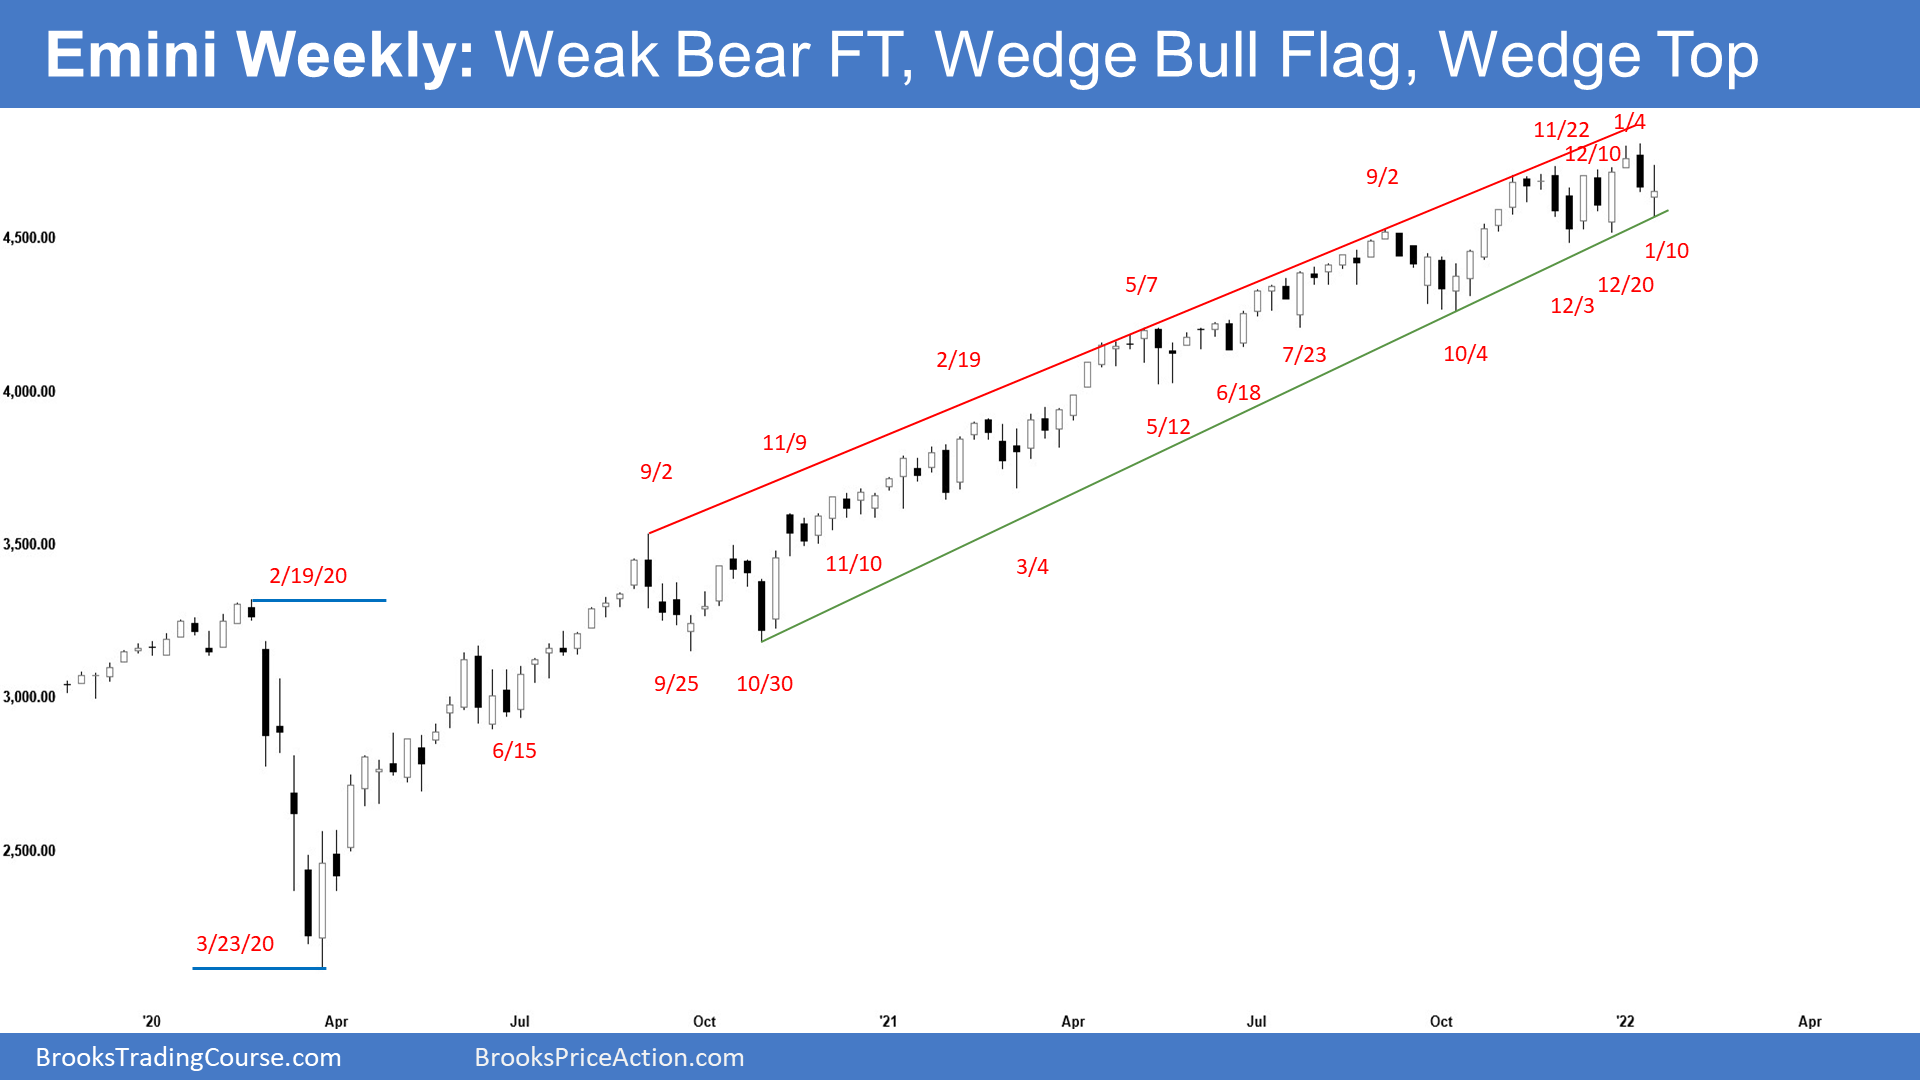
The SP500 Emini futures weekly candlestick was a bull doji bar. The bears failed to get follow-through selling following last week’s bear signal bar. The bulls see the 3 pushes down (December 3, December 20, and January 10) as a wedge bull flag and want a strong second leg sideways to up. Bears want a test of the December low followed by a measured move down (using the Nov-Dec trading range height) which will take them to the October low.
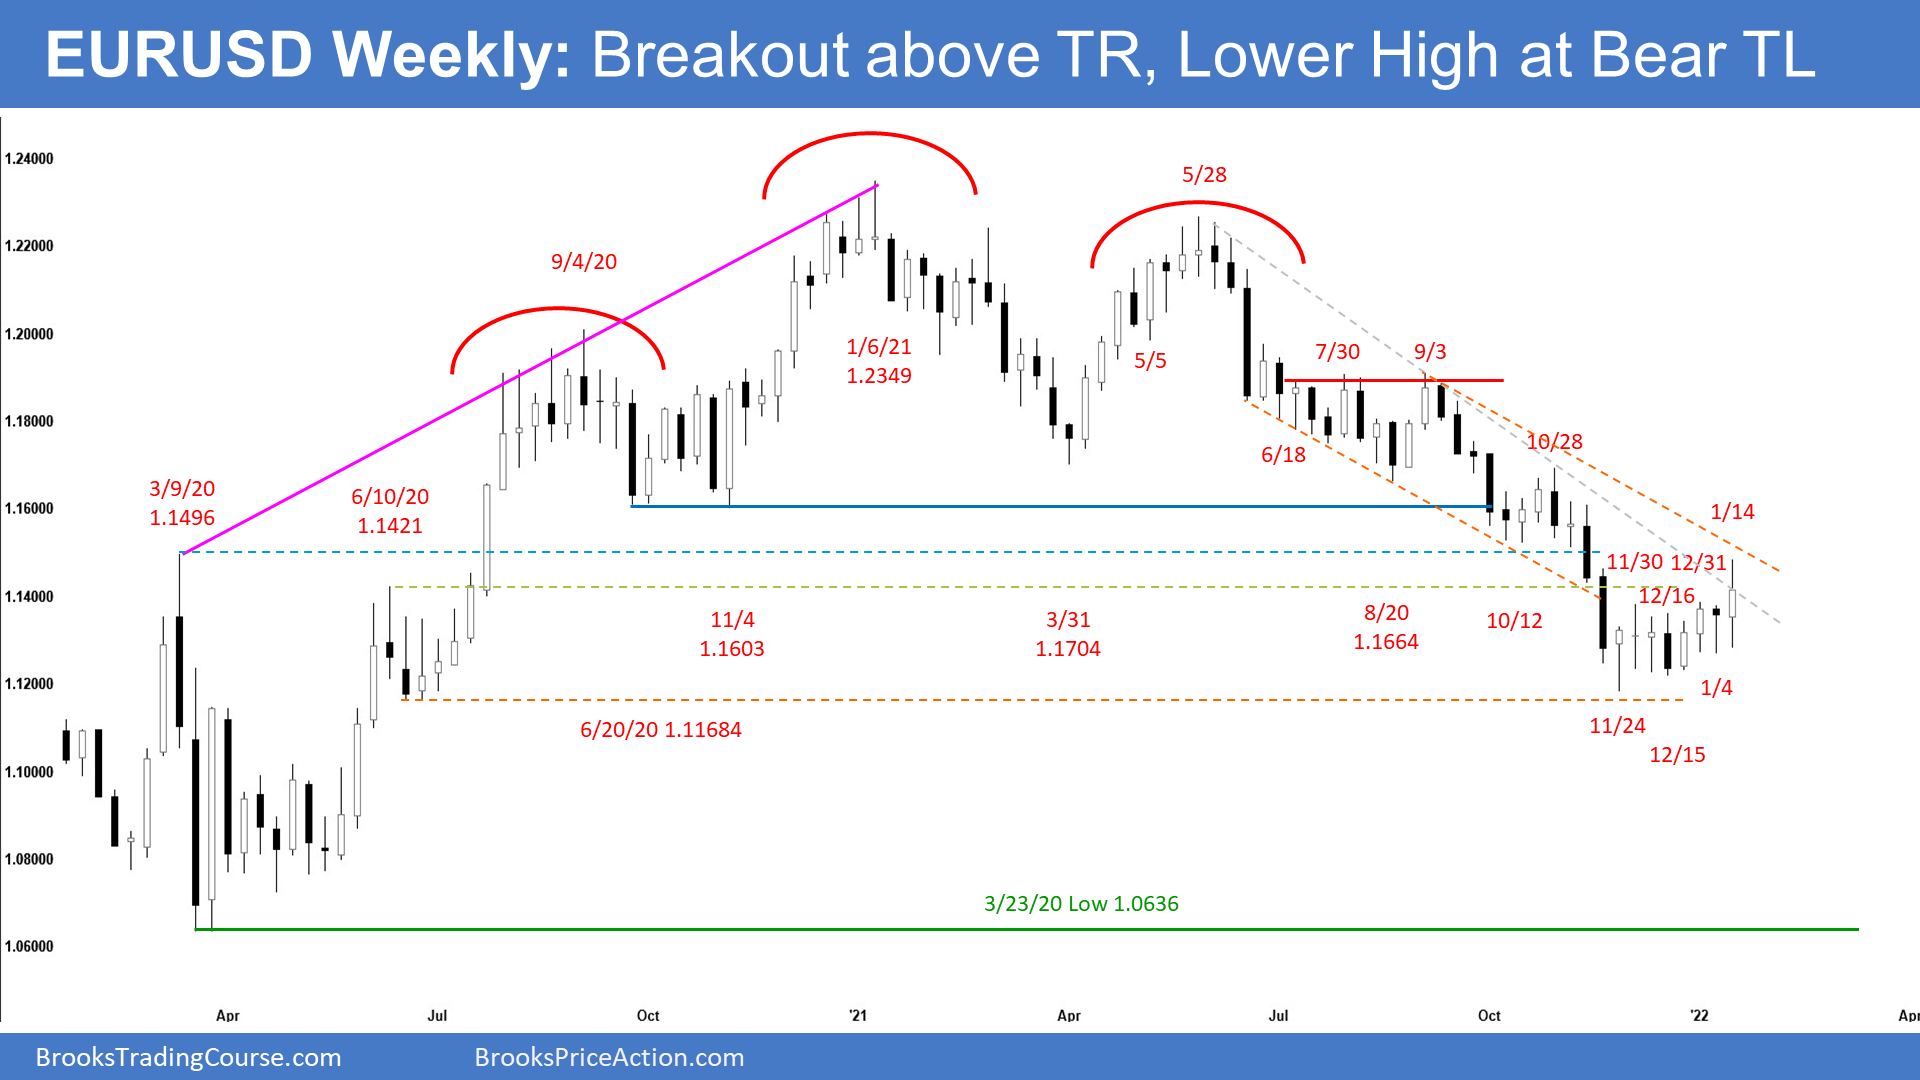
The EURUSD Forex broke above the 7-week tight trading range but the weekly candlestick has a prominent tail above and stalled around the bear trend line. The bulls will need strong follow-through buying next week. If they get a bull bar closing near its high especially above this week’s high, odds of a test towards November 10 and October 28 high increases. However, if next week closes as a bear bar near its low, the odds of a failed breakout above the tight trading range will increase.
EURUSD Forex market
The EURUSD weekly chart

- This week’s candlestick on the weekly EURUSD Forex chart was a bull bar with tails above and below. It broke above the tight trading range and tested the bear trend line and near the March 2020 high.
- However, the prominent tail above indicates the breakout was not as strong as the bulls would have liked.
- Since this week was a bull bar, it is a buy signal bar for next week. The prominent tail above makes it a weaker signal bar.
- The bulls will need follow-through buying next week to convince traders that a reversal higher is underway. If the bulls manage to get a strong bull bar closing near its high and above this week’s high, odds of a reversal back towards the October 28 high increases.
- If next week instead is a bear bar closing near its low, odds of a failed breakout increases. Bears will see it as a low 1 short from a lower high at resistance (bear trend line).
- The bears are hoping this is simply a double top bear flag (November 30 and January 14) to be followed by a continuation of the measured move lower.
- However, a tight trading range late in a trend often is the final flag of the move. Even if there is a break below the 7-week trading range, odds are it might be the final flag of the bear leg. The EURUSD may then test below June 2020 low before there is a stronger reversal higher from a lower low major trend reversal.
- A tight trading range is an area of balance and a breakout mode situation. There is a 50-50% probability of a bull and bear breakout. It also means that there is a 50% chance that the first breakout up or down will fail and reverse.
- Al has been saying for a few weeks that there should be a sideways to up move lasting at least a couple of months starting from where the EURUSD is now or from slightly lower. The EURUSD is in the middle of a 7-year trading range. Legs rarely go straight from the top to the bottom without some confusion, which is a hallmark of a trading range. This last year has been clearly bearish. Clarity does not last forever in trading ranges.
- Al has also said that currencies have an increased chance of reversing in early January. The current bear trend began on January 6th of 2021. The bears hope that the yearlong bear trend is a resumption of the bear trend that began in 2008. More likely, the seven-year trading range will continue.
- A 2021 selloff is still more likely a pullback from the 2020 rally than a resumption of the bear trend that began 14 years ago.
- There is only a 30% chance that this selloff will continue down with only brief pullbacks and then break strongly below the 7-year trading range.
The EURUSD daily chart

- The EURUSD broke above the 7-week tight trading range with strength on Wednesday and got a weak follow through on Thursday testing near March 2020 high but stalled at the bear trend line.
- Friday was a bear bar but had a prominent tail below. Bulls see this as a breakout test of the tight trading range high.
- Bulls will need a resumption of the rally early next week to convince traders that a reversal towards November 10 high and October 28 high is underway.
- The first target for the bulls is a breakout above the October 12 low, which was the breakout point for the November collapse.
- Al said that the most important target is the October 28 major lower high. If the bulls break strongly above that, then the yearlong bear trend will have ended. The daily chart would then either be in a trading range or a bull trend.
- If the bears get consecutive bear bars closing near their lows and the EURUSD trades back into the 7-week tight trading range, traders will then conclude that the recent breakout above has failed.
- The bears see the current move as a lower high test of the bear trend line and breakout point and want the breakout above the tight trading range to fail. They then want a test and breakout below the 7-week tight trading range low followed by a continuation of the 700-pip measured move lower.
- However, the bears have not been able to create follow-through selling and consecutive big bear bars in the last 4 weeks. The bull bars are more prominent, have bigger bodies and more closes near their highs and has a series of higher lows. The odds slightly favor the bulls in terms of buying pressure.
- We have said that a trading range is an area of balance and a breakout mode situation. There is a 50-50% probability of a bull and bear breakout. It also means that there is a 50% chance that the first breakout up or down will fail and reverse. This remains true.
- If there is a break below the 7-week tight trading range, odds are it will be the final bear flag of the bear leg followed by a stronger reversal higher from a lower low major trend reversal, probably from slightly below June 2020 low.
- Al has said that the EURUSD is in a 7-year trading range, so traders still expect a couple of months of sideways to up trading to begin soon.
- There’s only a 30% chance that the small pullback bear trend will continue down to last year’s low without at least a rally lasting a couple of months or more.
S&P500 Emini futures
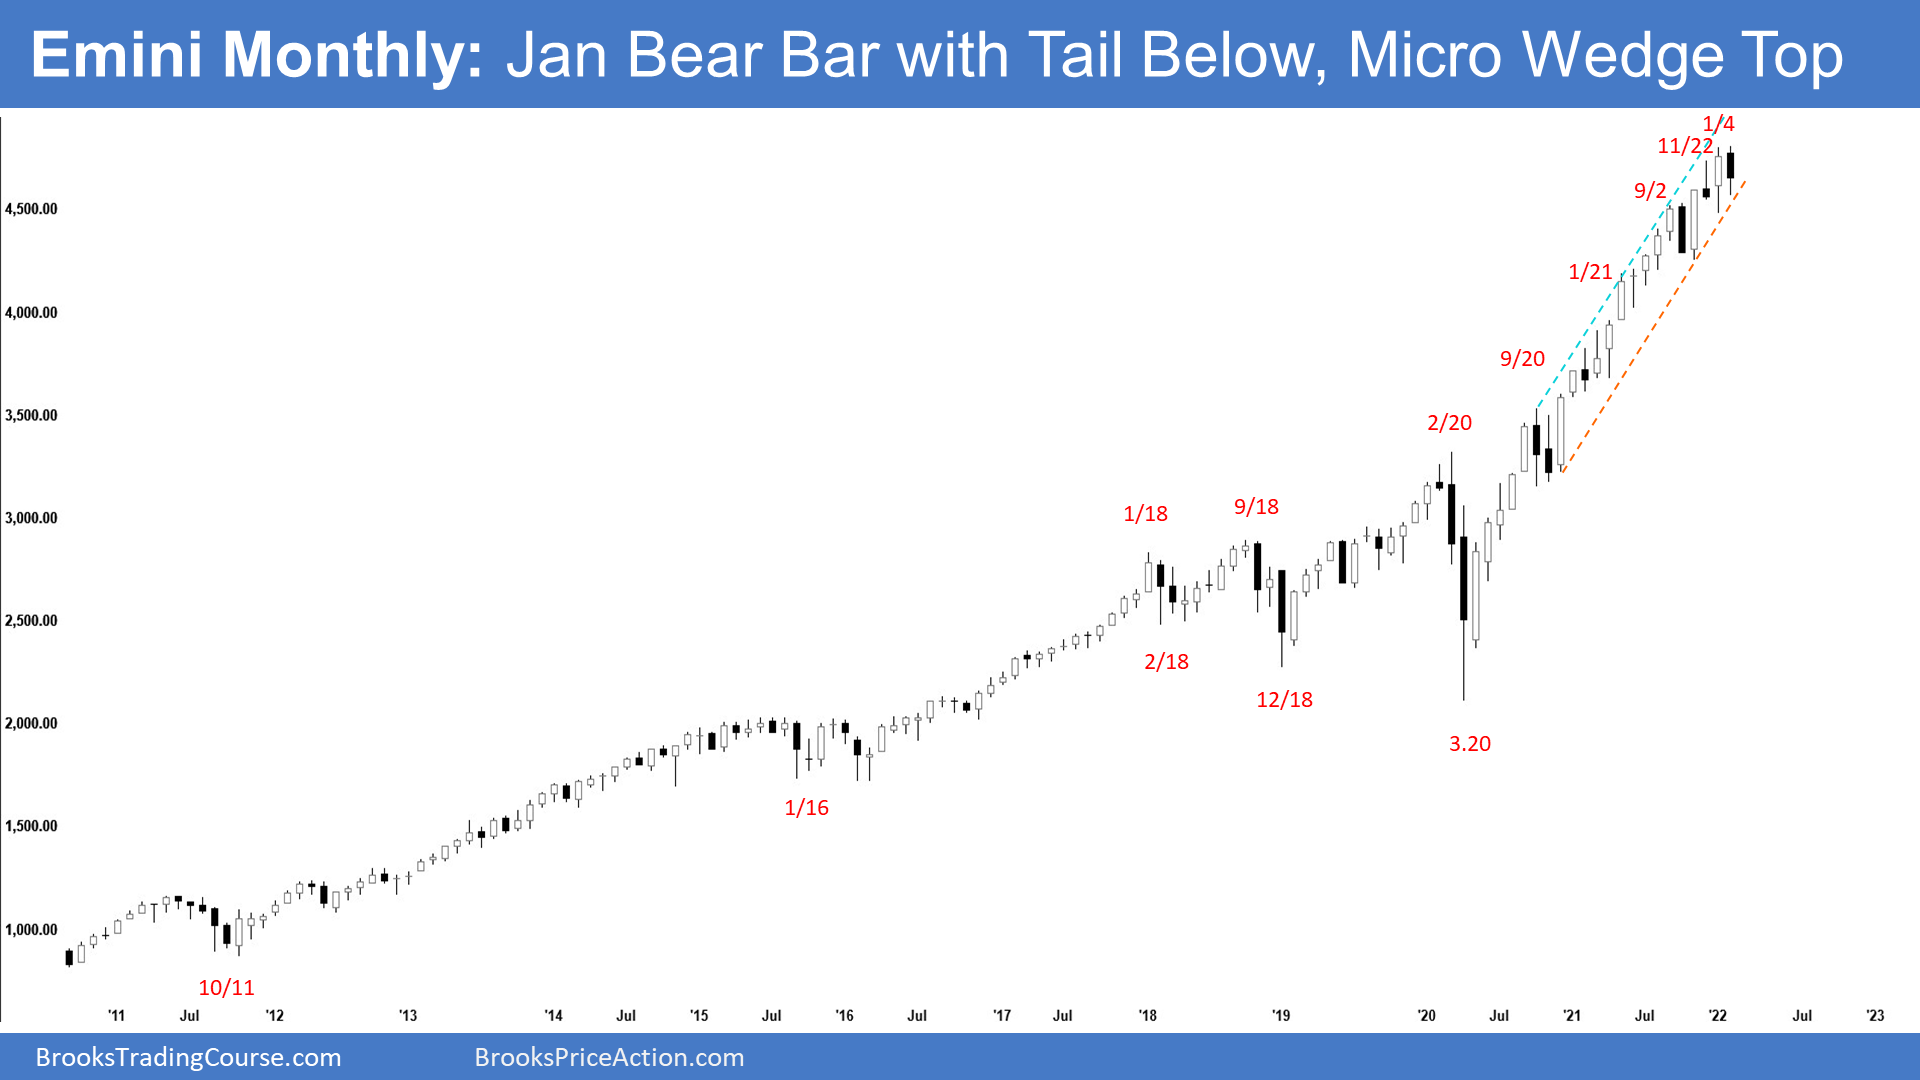
The Monthly Emini chart

- The January monthly Emini candlestick currently is a bear bar with a tail below after making a new high. It is the 3rd reversal since September.
- December was a bull bar closing near its high therefore it is a weak sell signal bar for a strong reversal down.
- The bears want a reversal lower from a micro wedge even though January traded slightly higher first. They want January to be a failed breakout above December outside up bar, like November. A third reversal has a higher probability of working.
- December is the third leg up where the first legs up were August and October so therefore a micro wedge. Since the bull trend is extreme, traders are looking for reasons to take some profits. A micro wedge is often a trigger for profit-taking. That would probably lead to a couple of bars sideways to down.
- If January is a bear bar closing near the low, it would be a sell signal bar for February. The more this month closes on its low, the more it will attract sellers, and the more likely the Emini will pull back for a few months.
- Al has said that the bull trend on the monthly chart has been very strong. Therefore, even if there is a sharp selloff down to the October low in the 1st half of this year, it should be minor.
- The best the bears will probably get on the monthly chart is a trading range for many months. A trading range in a bull trend is usually a bull flag. Therefore, traders should expect a bull breakout of the trading range later in the year.
- The best the bears probably can get this year is a 20% correction down to the gap on the monthly chart below April 2021 low and around the 4,000 Big Round Number.
- The bulls want a continuation higher to a measured move target (using the Aug-Oct trading range height) which will take them to 4930 near the top of the trend channel line. The 5000 big round number is a magnet above.
- Can this rally continue up throughout 2022 without a pullback? That is less likely. It is overextended and there is a likely micro wedge forming.
- Therefore, the bull trend will probably transition into a trading range for at least a couple of months.
- For example, if the market were to get down to the October low, then the trading range would have begun in August and there would be a six- or seven-month trading range on the monthly chart.
- At that point, the bulls will try to get a resumption up from a double bottom bull flag and the bears will try to get a bigger reversal down.
- Al has said that the bull trend from the pandemic crash has been in a very tight bull channel. The first reversal down will probably be minor even if it lasts a few months and not continue straight down into a bear trend. Even if it sells off for 10 to 20% correction, that would still only be a pullback on the monthly chart even though it could be a bear trend on the daily chart.
- Al also said that the gap up in April 2021 could lead to a measured move up to 5,801.5 before the bull trend finally ends.
The Weekly S&P500 Emini futures chart

- This week’s Emini weekly candlestick was a bull doji. The bears failed to get strong follow-through selling from last week’s strong sell signal bar. It is a high 1 buy signal bar at the bull trend line. However, because it is a bull doji, it is a weak buy signal bar.
- The 11-week tight trading range has higher lows (December 3, December 20, and January 10). The bulls see this as a wedge bull flag with higher lows instead of the traditional downward sloping wedge bull flag.
- They want another strong leg up like the one from October 4 to November 5. A leg 1 = leg 2 measured move will take them to 4930 around the top of the bull channel. The 5000 big round Number is a magnet above.
- A tight trading range is a breakout mode pattern and has a 50-50% chance of a successful bull or bear breakout. It also has a 50% chance that the first breakout up or down will fail and reverse within a couple of bars. Because it’s in a strong bull trend, a bull breakout is slightly more likely than a bear breakout.
- A tight trading range late in a trend often is the final bull flag. A breakout above it may fail within 3 to 5 weeks, possibly at the top of the bull channel and possibly around the 5000 big round Number.
- Can next week reverse higher following this week’s test of the bull trend line? The tight bull channel on the weekly chart means the bulls have been buying small pullbacks since the pandemic crash. The bull trend line has been a strong support of the tight bull channel. Until the bears break below it with consecutive big bear bars and follow-through selling, odds are traders will continue to bet on higher prices.
- Can next week be a big bear bar closing near the low? The probability of this is slightly lower than the bull’s case. If it does, it will be a breakout below the bull trend line and increase the odds that a pullback towards the October low is underway especially if it closes below December’s low.
- The bears want a reversal lower from a higher high double top (January 4 and November 22) or a wedge top (September 2, November 22, and January 4). They want a test of the December low followed by a measured move down which will take them to the October low.
- However, the bears have not been able to create follow-through selling and consecutive big bear bars closing near their lows. Without that, traders would not be convinced that a deeper pullback may be developing.
- An embedded micro wedge may be forming where the first legs up are December 10 and January 4. If we get another leg up to a new high, it would be the 3rd leg up since December. A micro wedge in a wedge top has a higher probability of leading to profit-taking pullback.
- Al has said that the Emini has been in a strong bull trend since the pandemic crash. There have been a few times when the bears got the probability of a correction up to 50%, but never more. The probability of higher prices has been between 50 and 60% during this entire bull trend. It has never been below 50%. That continues to be true.
- The strong selloffs, like in September in 2020 and again in 2021, pushed the probability for the bears up to 50%. But every prior reversal has failed, and the bears never had better than a 50% chance of a trend reversal.
- This week’s doji bar is an area of balance. There may be some sideways trading range first before traders decide on the direction of the market.
- Odds slightly favor sideways to upside more.
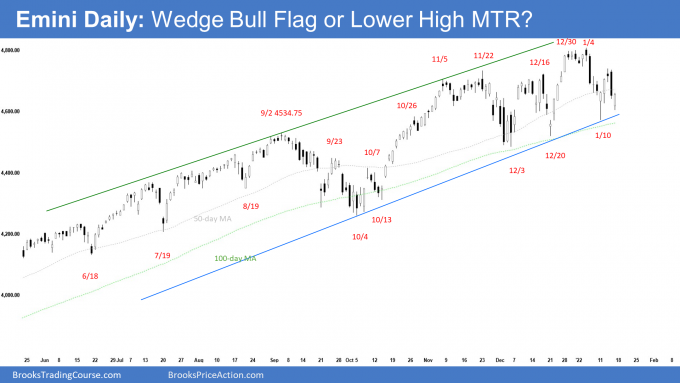
The Daily S&P500 Emini futures chart

- The Emini gapped down on Monday and tested the bull trend line and the 100-day moving average but reversed back up by Wednesday to about a 50% pullback (bounce) of the early Jan bear leg.
- Thursday formed a lower high major trend reversal lower but there was no follow-through on Friday.
- Friday’s candlestick was a bull bar closing near its high. It is a high 2 bull signal bar for Monday from a higher low at the bull trend line and 100-day moving average support.
- The bears are hoping that the Emini is reversing down from a wedge top (September 2, November 22, and January 4) and a lower high major trend reversal.
- They want a pullback to the December 3rd low and then a breakout and measured move which would take them down to the October 4 low which was the start of the wedge rally, and which is a common magnet after a wedge reversal.
- If the bears can create consecutive big bear bars closing near their lows breaking below the bull trend line and the 50-day and 100-day moving average, the odds of a deeper pullback towards the October low increases.
- However, every pullback has been bought by the bulls since the pandemic crash. The 50-day and 100-day moving average and bull trend line remain strong supports. Until there is a strong break with follow-through selling below these support levels, bulls will continue to bet on higher prices and every pullback to be minor.
- The bulls see the 3 pushes down (December 3, December 20 and January 10) as a wedge bull flag. They want a second leg sideways to up like the one from October 4 to November 5. A leg 1 = leg 2 measured move will take them to the top of the bull channel around 4930. If the Emini gets there, odds are it will test the 5000 big round number magnet above.
- Al said that the entire rally from July looks like a bull leg in what will become a trading range. Trading ranges often begin before bull or bear trends end.
- For the Emini to evolve into a trading range, it needs a bear leg. Once the bear legs start to fall below prior lows, like the December 3 low, traders will conclude that the bull trend has evolved into a trading range. The Emini should then fall to the October low or slightly lower.
- However, it will probably form a double bottom bull flag with one of those significant prior lows instead of continuing down into a bear trend.
- For now, the Emini may trade sideways briefly around the 50-day and 100-day moving average above the bull trend line before traders decide on the direction of the breakout of the 11-week tight trading range.
- Odds slightly favor sideways to up more.
Trading Room
Traders can see the end of the day bar-by-bar price action report by signing up for free at BrooksPriceAction.com. I talk about the detailed Emini price action real-time throughout the day in the BrooksPriceAction.com trading room. We offer a 2 day free trial.
Weekly Reports Archive
You can access all weekly reports on the Market Analysis page.


Thanks for the comprehensive report Andrew. Not clear to me the bull wedge on the daily chart (Dec’ 3rd, 20th and January 10th) given those 3 pushes have created HL and not LH?
Meant to say LL.
Dear Eli, you’re most welcome..
Al can correct me if my interpretation is not accurate.
1. A traditional wedge bull flag is downward sloping with each subsequent leg pushing slightly lower than the prior one – a LL.
2. When a trend is very strong:
a. The pullback sometimes have 2 legs (double bottom bull flag – (usually LL, but can be HL if the bears failed to push prices lower and traders are eager to buy even before prices fall lower)
b. or, if the pullback has 3 legs, then it would be interpreted as a wedge bull flag (again, usually LL, but can be HL if the bears failed to push prices lower and traders are eager to buy even before prices fall lower)
3. However, in any case, the price action had overlapping prices so it might be better to be interpreted as a trading range.
4. Often, when I have come across a pullback phase which is sloping up instead, usually that indicates very strong bulls.
5. If you see the weekly chart on SPX, there were 3 pushes down in May/June 2019, Aug 2019 and Sept/Oct 2019 followed by another strong leg up into 2020. It might be better to read the price action as a trading range with HL. But it is also a wedge bull flag as it has 3 pushes down albeit with HL.
This is my take on it.
Thanks for going through the report. Have a great week ahead Eli!
The weekly channel in the Emini is long and strong. Is it more likely to end with an over shoot before a bear break out?
A blow-off top is a 50-50 bet. It is equally likely that it will simply break the bull trend line either by going sideways or down.