Monthly S&P500 Emini futures candlestick chart:
New all time high breakout
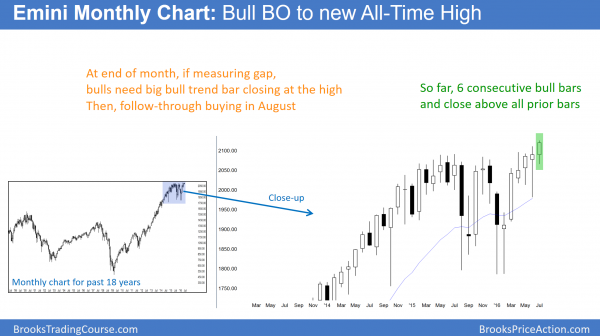
The monthly S&P500 Emini futures candlestick chart had a new all-time high breakout. While the month has a long time before it closes, its current close is at a new high. The bulls need a strong close at the end of July. Furthermore, they need follow-through buying in August.
The monthly S&P500 Emini futures candlestick chart is at a new all-time high, and the current close is above last month’s high. It is still early in the month. The bulls want this month’s close to be far above last month’s high. Furthermore, they want this month to close on its high.
While the bulls want a strong breakout, the bears always want the opposite. Although they do not want the Emini to be at a new high, they will still be happy if they can create a reversal. They want July to close on its low and to be a big bear trend bar. At a minimum, the want July to not be a big bull trend bar. Even if July is strong, the bears will try to create bad follow-through in August.
At the moment, the bulls are in control and there is no sign of a top. This is the 6th consecutive bull month. Hence, the bulls are strong and they will buy a reversal down.
Weekly S&P500 Emini futures candlestick chart:
Strong entry bar for a bull breakout
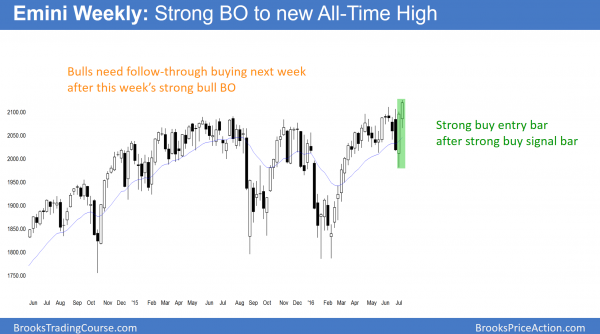
The weekly S&P500 Emini futures candlestick chart had a buy signal bar 2 weeks ago. This past week was a strong entry bar for the bulls.
The weekly S&P500 Emini futures candlestick chart 2 weeks ago created a buy signal bar. However, the bar was very big. Therefore, the risk for the bulls buying above it high was big. Hence, they had to trade very small. While Thursday’s breakout above the high triggered the buy signal, there bears created a deep pullback immediately afterwards.
The bulls once again broke above the buy signal bar high on Friday. They were strong enough to close the week at a new all-time high. While next week could be a bear bar and therefore represent bad follow-through buying, the odds favor higher prices over the next few weeks. The bears need a strong reversal down next week or the week after. Without that, the bulls might reach a measured move up based on the 100 point height of the 4 month trading range.
Daily S&P500 Emini futures candlestick chart:
New all-time high breakout
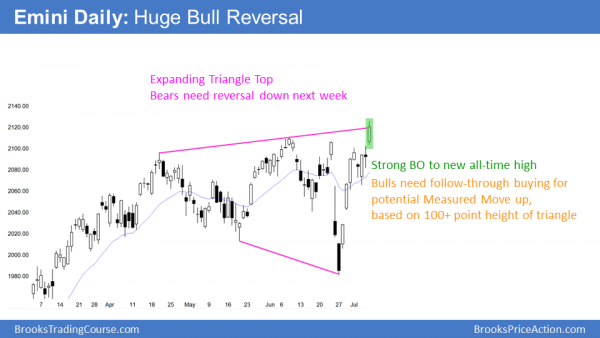
The daily S&P500 Emini futures candlestick chart broke to a new all-time high. It also closed at a new high. Yet, if the breakout fails, the reversal will create an Expanding Triangle Top.
The daily S&P500 Emini futures candlestick chart gapped up and rallied to a new all-time high today. It also closed at a new all-time high and consequently created a sign of strong buying pressure. The odds favored at least a small 2nd leg up after the strong bull reversal 2 weeks ago. While it is possible that today was the end of that 2nd leg up and today’s breakout fails, it is more likely that there will be at least some follow-through buying next week.
The S&P500 Cash Index
Today’s Emini rally was caused by a buy vacuum in the cash index. The cash index was drawn up to test its all-time high. Since the Emini is so closely tied to the cash index, the cash index bulls caused the rally in the Emini.
The cash index came to within 3 points of its all-time high of May, 2015. This is close enough for traders to conclude that the current rally tested the all-time high. If it reverses down from here or from slightly above the old high, the bears will conclude that it formed a double top candlestick pattern. Hence, they will sell the reversal down, looking for a test of the bottom of the 4 month trading range.
The bull case
The bulls want a breakout to a new all-time high. Furthermore, they want the breakout to be strong. A strong breakout can be a single big bull trend bar followed by at least one more day with a bull body. Yet, it can be less dramatic, but just as strong. If there is a series of ordinary size bull trend bars closing on their highs, they would create a strong breakout. On a higher time frame chart, they would form a single big bull trend bar. As a result, they would represent a strong breakout on the daily chart.
The bear case
The bears always want the opposite. They want the breakout to fail. Since the breakout so far is strong, the bears would usually need at least a micro double top. They then would need a strong reversal down with follow-through selling. While the reversal can be a single huge bear trend bar, it more often is a series of consecutive bear trend bars. There is no sign of a reversal yet. The bulls still have a 40% chance of a strong rally and a measured move up.
Will the breakout succeed?
Because most breakouts fail, traders will watch next week for follow-through buying. If next week begins with several strong bull trend bars that close on their highs, expect higher prices. There would therefore be a high probability that the Emini would continue higher and reach measured moves targets.
It is more likely that the follow-through buying next week will not be strong. At a minimum, the bulls want to avoid a bear reversal. The bears obviously want a strong reversal down early next week. If they get it, it would be a failed breakout on the daily Emini chart. The candlestick pattern would be an Expanding Triangle Top, which is a type of a Higher High Major Trend Reversal. Because the cash index is testing its high, the reversal would create a double top in the cash index.
Traders can see the end of the day bar-by-bar price action report by signing up for free at BrooksPriceAction.com. I talk about the detailed Emini price action real-time throughout the day in the BrooksPriceAction.com trading room, and a 2 day free trial is available.
When I mention time, it is USA Pacific Standard Time (the Emini day session opens at 6:30 am PST, and closes at 1:15 pm PST). You can read background information on the intraday market reports on the Intraday Market Update page.


Invaluable insight for us rookies. Thank you immensely!
Al,
Thank you for your commentary.