Market Overview: Weekend Market Analysis
The SP500 Emini futures in strong bull trend on all time frames. However, there is now a sell signal bar for a small minor double top on the weekly chart, just below the 4,000 Big Round Number. Traders expect higher prices, even if there is a 1- to 2-week pullback first.
Bond futures are in extreme sell climax in a support zone so traders expect a profit-taking bounce soon.
The EURUSD Forex in weak reversal down from last year’s wedge top on the weekly chart. November low at 1.16 is target below.
30-year Treasury Bond futures
The Bond futures weekly chart: Sell climax near support
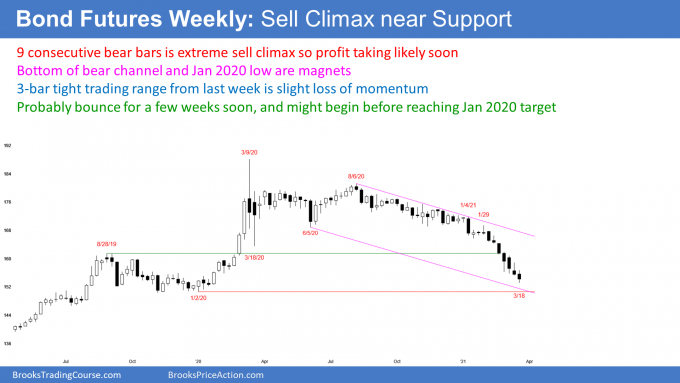
- Nine consecutive bear bars so traders are still eager to sell. Should reach January 2, 2020 major low this year.
- But this is unusual, and therefore unsustainable and climactic. Stop for bears is far above, and easiest way to reduce risk is to reduce position size.
- Extreme sell climax now near bottom of bear channel, and in late 2019 trading range, so should get profit-taking bounce soon.
- Prior 3 weeks had a lot of overlap, which means hesitation and minor profit taking. Possible small Final Bear Flag.
- 1st reversal up will be minor after 9 consecutive bear bars. That means it will be a bear flag. But because tight bear channel has lasted long time, profit taking could last a couple months, and it will probably have a couple sideways to up legs.
EURUSD Forex market
The EURUSD weekly chart: Small Pullback Bear Trend after wedge top
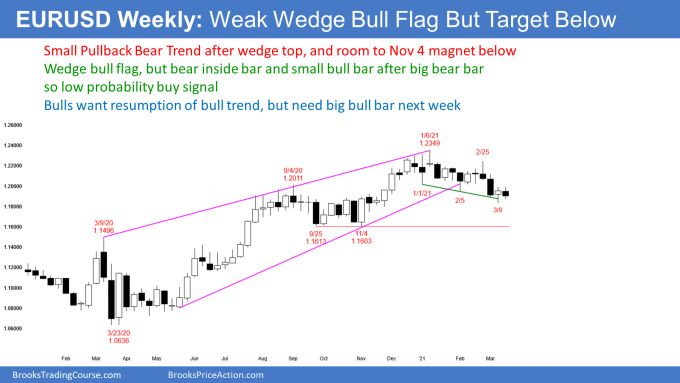
- Selling off for 3 months after 10-month wedge top. Broke below bull trend line (bottom of wedge bull channel), but the breakout has been more sideways to down instead of strongly down. This is not yet a strong breakout.
- Reversal from wedge top typically tests bottom of final leg up, which is November 4 low around 1.16.
- Selloff is Small Pullback Bear Trend and Endless Pullback from strong 2020 rally. It has had many reversals, and overlapping bars, so probably not a bear trend reversal. More likely protracted pullback from 2020 bull trend.
- Last week was buy signal bar for a wedge bull flag. This week did not go above last week’s high to trigger the buy signal. The setup is weak because this week is a bear bar, and last week was small bull bar following a big bear bar. Also, the 3-month bear channel has been tight.
- Bulls might try again this week to get reversal up, but probably only minor. Could go sideways to up for several weeks, like in February.
- Bulls need consecutive big bull bars to convince traders that 2020 bull trend is resuming.
S&P500 Emini futures
The Monthly Emini chart: Small parabolic wedge top
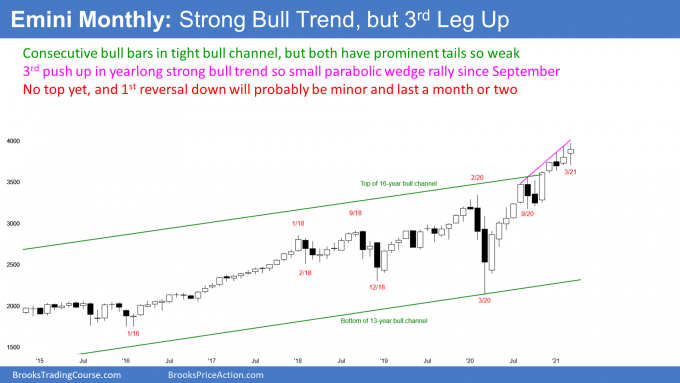
- Bull bar but small body, and close below February high, so loss of momentum. Traders buying, but less aggressively.
- Eight trading days remaining in March, so plenty of time for bar to look different when month closes.
- Nearby target above is 4,000 Big Round Number.
- If month has big tail on top when it closes, then micro wedge with January and February. It is nested within a parabolic wedge, where the 1st 2 legs up were September and January.
- 13-month tight bull channel so traders will buy 1st 1- to 2-month pullback.
- If reversal down, only 30% chance of 20% correction.
- This is the 4th month of the breakout above the 17-year bull channel. An average breakout above a bull channel has 75% chance of starting reversal down back into the channel within about 5 bars (months). Because 13-month rally is so strong, odds here are 50%.
The Weekly S&P500 Emini futures chart: Small double top
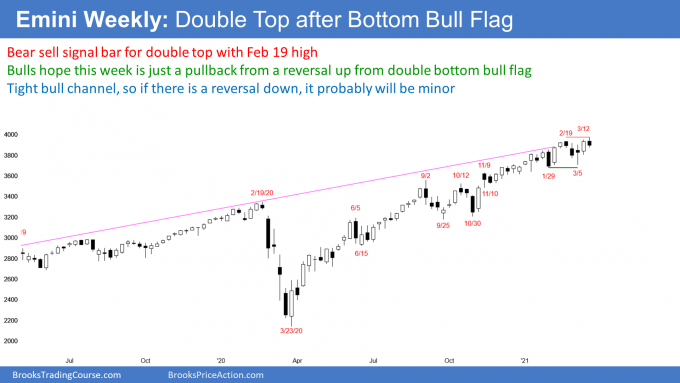
- Bear bar so sell signal bar for minor double top with February 16 high, at top of bull channel.
- 40% chance that a reversal down from this area will test November 10 low at 3500.
- 30% chance that a reversal from this area will test the September/October double bottom at 3,200.
- Bears need big bear entry bar next week, if expecting test of 3,700 bottom of 3-month trading range. More likely, a reversal down will only last a week or two, before the bulls buy again.
- Since 13-month bull channel is tight, the best the bears probably can get is another trading range, like in September and October.
The Daily S&P500 Emini futures chart: Higher high major trend reversal, but likely will become bull flag
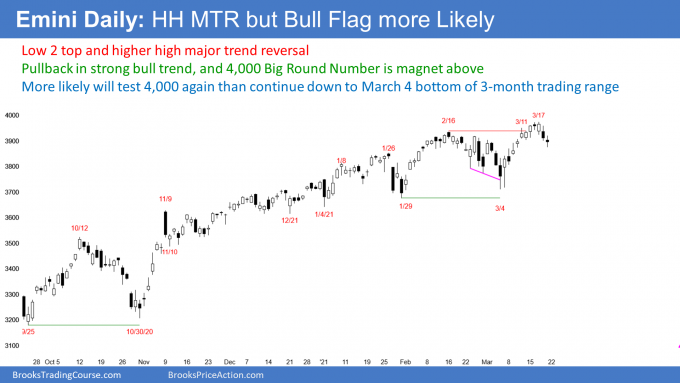
- Sideways for 7 days just below 4,000 Big Round Number.
- Bulls want strong breakout above 4,000.
- Bears want reversal down from around 4,000. This 3-day reversal is a higher high major trend reversal.
- Wednesday was the 3rd top in a 5-day micro wedge. That is a wedge top on the 60-minute chart. Thursday reversed down.
- Thursday was a big bear day after a big bull day, with very little overlap of the 2 bodies. This means the bulls who bought during the bull day, are now trapped and it increases the chance of lower prices.
- Bears need consecutive big bear bodies to flip odds, in favor of a selloff, down to bottom of 2021 trading range at 3,700. Without that, traders will continue to buy 1- to 3-day selloffs, expecting another new high.
- Even if bears get 10% correction to bottom of 3-month trading range, a bounce and a continuation of the range is more likely, than a breakout below and a 300-point measured move down.
Trading Room
Traders can see the end of the day bar-by-bar price action report by signing up for free at BrooksPriceAction.com. I talk about the detailed Emini price action real-time throughout the day in the BrooksPriceAction.com trading room. We offer a 2 day free trial.
Charts use Pacific Time
When I mention time, it is USA Pacific Time (the Emini day session opens at 6:30 am PT, and closes at 1:15 pm PT). You can read background information on the intraday market reports on the Market Update page.


Hi Al, your course has been very helpful for understanding the markets, could you please analyse xauusd I think most people who trade forex with microlots like me trade this pair. Also it’s in a very interesting place right now could be good for a long term buy?
Hi Al, I’m in agreement with Charles and was wondering if you could analyize it as well.
I only trade XAUUSD, it’s such a popular product in the Forex world, possibly more so than EURUSD. If you would start analyzing it regularly, even just once a week like you do bonds, I’m sure a lot of people would find it helpful and appreciate it!
Thank you, sir.
Oh, and btw, I really like the new bullet point format you’ve been publishing your analysis in. It’s much easier to go read.
I would like to analyze several other markets, but my problem is time. I am already doing so much that I cannot get started on a few other projects that I want to do.
Al, here is another blog I’m writing specifically towards the SPX and related markets.
Implementing all that I have learned from you through the years.
For your reading pleasure if you are free. Published weekly:
Sithtrader.com — Weekend Update
This is the earlier one on commodities I shared with you earlier, also published weekly:
Palmanalysis.com — Weekly Report.
Didn’t the bull who bought on Wednesday got out during the big tail on top of Thursday’s bear bar? so why were the bulls got trapped?
I’ll try my hand at that. Were in a trading range, Wednesday was a rally to a new high above that range. Disappointed bulls expected a second leg and instead got a HH MTR. Expect that even strong rallies to fail in a trading range unless there is a breakout with follow-through meaning consecutive bull trend bars above the entirety of the range. So some bulls hoped to get out break even and got close stop losses get triggered and we get a cascade down to lower prices. Could be wrong, always learning.
According to Bank of America this has been the 3rd largest year to date drop in the long bond since 1973.