Market Overview: Weekend Market Update
The Emini sold off on Friday. There is a 50% chance that this is the start of a 15% correction. But there is also a 50% chance that the Emini will first test the gap on the weekly chart above the February 24 high.
Bond futures are stuck in a 3 month tight trading range. After the huge reversal down from the extreme buy climax in March, traders think bonds will be sideways to down for several months.
The EURUSD Forex market reversed down from a 2 year bear trend line. But the June rally was exceptionally strong. Traders expect the reversal to become only a 2 – 3 week pullback from that bear trend line. They will then again try to break above it.
30 year Treasury Bond futures weekly chart:
Weak entry above High 1 bull flag
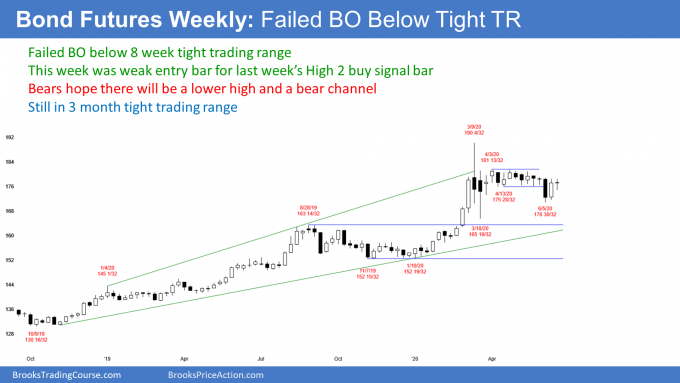
The 30 year Treasury bond futures reversed up 2 weeks ago. Last week was a High 2 bull flag buy signal bar.
This week triggered the buy signal by going last week’s high. But it only went 1 tick above and then traded sideways. This week was a doji bar, which is neutral.
Furthermore, the bond futures market is back in the middle of a 2 month tight trading range, which is also neutral. Traders are deciding whether the bond futures will resume its 20 year bull trend or pull back more. The monthly chart is telling traders that any rally from here should be minor.
Pullback from most extreme buy climax in history on the monthly chart
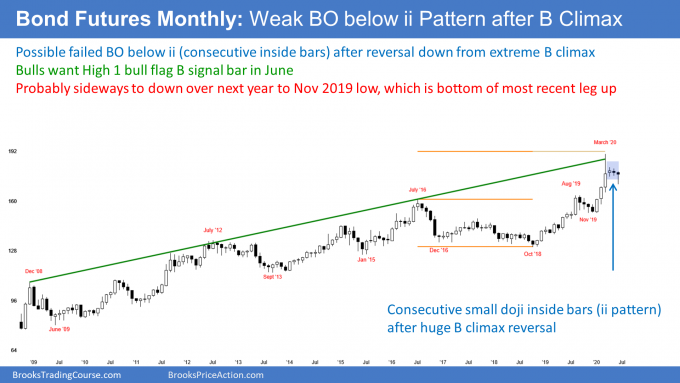
The 3 month rally that started the year was the most extreme buy climax in history on the monthly chart. There was a big reversal down in late March. Traders see that as a climactic reversal in a very overbought market.
Sometimes a big reversal like that will begin a bear trend. Usually, however, the trend ends, at least temporarily, and the market then goes sideways. That is what is happening here.
The exhausted bulls at some point will buy again. We do not yet know if they will buy at the current level or much lower.
When there is an extreme buy climax, traders expect the pullback to test the bottom of the lest leg up. That is the January low of 152 19/32.
A rally from here would be minor
If instead a bull trend resumes now, after just a 3 month pullback on the monthly chart, traders do not believe it will reach the old high. Three bars is usually not enough time for exhausted bulls to buy again. They typically wait about 10 bars and for 2 clear legs down.
Also, they want the reversal to reach major support, like the January low. Any rally before then usually forms a lower high.
Therefore, while this week triggered a weekly buy signal, there was very little buying. Traders expect a deeper selloff lasting about a year before the bulls will be willing to buy aggressively again. Since this is a monthly chart, traders expect about a year.
Consequently, any rally from here will probably form a lower high. Traders expect lower prices over the next year, even if there is a 2 – 3 month rally first.
EURUSD Forex weekly chart:
Minor reversal down from top of 2 year bear channel
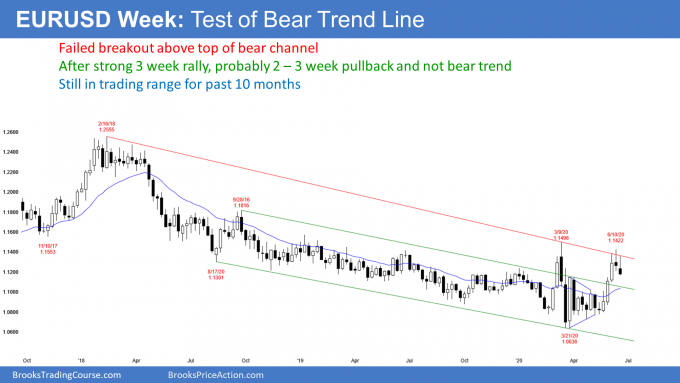
The EURUSD Forex weekly chart triggered a minor sell signal this week when this week traded below last week’s low. The bears want last week to be the start of a reversal down from the top of the 2 year bear channel.
They see 2 legs up from the March low. The 1st leg was the big bull bar that began on March 23. The EURUSD then went sideways for a couple months.
Their 2nd leg up was the 3 bar rally that ended on June 10 at the bear trend line. If the bears do get a reversal down from here, that 2nd rally will then be a 2nd Leg Bull Trap in a 2 year bear channel.
Test of 2 year bear trend line, but weak sell setup
While it is possible that last week is the start of a bear trend, the bears need stronger bear bars. Last week’s sell signal bar was a doji. That is a sign of neutrality, and not a strong reversal down. It is a weak sell signal bar.
This week was the entry bar, but the body was relatively small. That means that the sellers are not yet aggressive. The combination of a weak sell signal bar, an average entry bar, and a very strong rally typically results in a minor reversal. Traders expect a 2 – 5 week pullback before any other attempt to get above the March high.
It is important to note that there always is a bear case. What happens if the bears form 2 – 3 big bear bars closing near their lows? Traders would begin to think that the reversal down is a bear trend and not a pullback in a bull trend.
Also, what happens if the pullback never looks strong but falls below the April low at the bottom of the 2 month range? That again would make traders believe that the reversal down was a bear trend and not just a pullback.
When will the bulls buy?
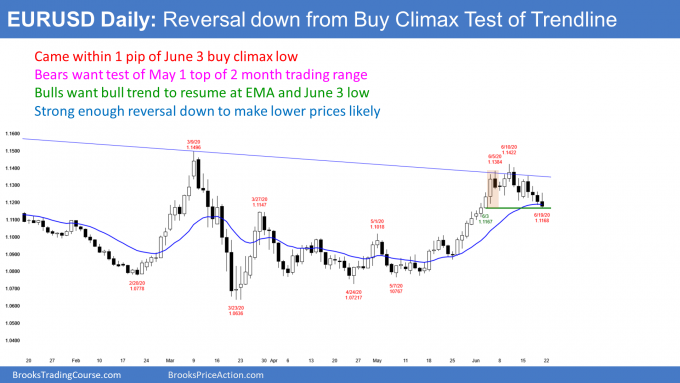
Even though the reversal is probably minor, it could last several weeks. On the daily chart, the minimum target is the June 3 low of 1.1167. That is the bottom of a strong 2 day rally.
When there is a reversal in a strong bull trend, the 1st target is always the bottom of the most recent buy climax. That is the June 3 low. This week got to within 1 pip, and traders expect it to trade below next week
The 3 week rally broke strongly above a 2 month trading range. Breakouts often pull back to the breakout point. That is the top of that trading range, around 1.10.
Monthly S&P500 Emini futures chart:
Rally is losing momentum
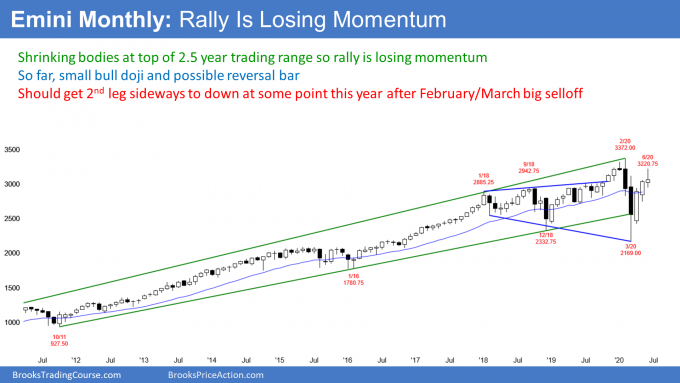
The monthly S&P500 Emini futures chart reversed up strongly in March from below a 10 year bull trend line and a 2 year trading range. April was the buy signal bar. It was a big bull bar closing near its high. That was a strongly bullish bar.
May was the entry bar for the High 1 bull flag buy signal bar in April. It, too, was a big bull bar closing near its high. This was a further sign that the bulls were strong. However, the body was smaller than in April. That means that there was some loss of momentum.
June’s close is important
June is only half over. It currently is a bull bar, but the body is small and the tails are relatively big. That is a further loss of momentum.
But, if the bulls can get June to close near its high, there would then be 3 consecutive big bull bars closing near their highs. That is strong momentum and it would make higher prices likely. Since the Emini would be just below the all-time high, traders would expect a new high in July.
More likely, June will not close near its high. There is still only about a 40% chance that this year’s rally will continue up to a new high this year.
If June closes in the middle of its range, it will have a bull body. Traders would expect the Emini to be mostly sideways in July.
The bear case is not strong
If June closed near its low, it would be a good sell signal bar. Traders would see this year’s rally as simply a test of the all-time high. June would be forming a double top with February. This would be a sell signal.
However, after 3 strong months up, it would be a minor sell signal. Traders would expect a reversal down to stall about half way down.
Big Down in March and Big Up in June creates Big Confusion. That typically leads to a trading range. Traders would therefore expect a reversal down to stall after a month or two. Then they would look for the monthly chart to go sideways for at least a couple months after that. I have been saying all year that the Emini would be in a trading range for 2020. That is still likely.
Weekly S&P500 Emini futures chart:
Emini bulls want a test of the February gap on the weekly chart
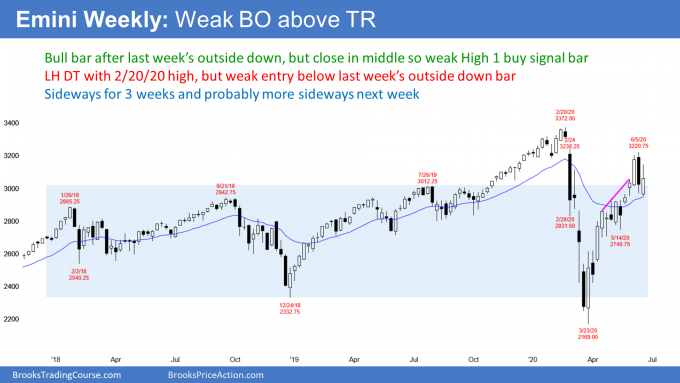
The weekly S&P500 Emini futures chart is still rallying from its March V bottom. It is in a Small Pullback Bull Trend. There have been only 2 pullbacks. Both were small and lasted only 2 weeks.
This week was a bull bar and the 2nd bar in a pullback. It is therefore a High 1 bull flag buy signal bar for next week.
However, this week closed in the middle of its range. That is neutral. This week is therefore a weak buy signal bar for next week.
But the 3 month bull trend has been strong. Therefore, there is a 50% chance that next week still will go above this week’s high and trigger the weekly buy signal.
A Small Pullback Bull Trend is a sign of strong bulls. However, the weekly chart has been having more bars with tails and more reversals over the past 9 weeks. When that happens in a bull trend, it usually indicates that the rally will soon evolve into a trading range.
It is important to note that the bull channel is tight and there is no strong top yet. Also, there is a 40% chance that the rally will continue to a new all-time high before the rally ends and a trading range begins.
February 24 Gap on the weekly chart is a magnet above
There was a big gap down in February at the start of the pandemic. The bottom of that gap is the February 24 high of 3,238.25.
Last week got near that target and turned down. When a market turns down from just below an important magnet, many traders do not trust the reversal down. They are unwilling to conclude that the resistance was adequately tested. This results in fewer traders willing to sell.
This is the current situation. The Emini might have to rally into that gap and then reverse down before traders will conclude that the 3 month rally has ended.
The bulls currently have a 50% chance of this rally reaching that gap. If it gets there, the odds of a new high will go up to 50% from the current 40%.
When a market reaches important resistance, traders expect either a big move up or down. Will there be a breakout or a reversal? The bulls want a series of big bull bars up through the gap and a successful breakout to a new high. However, the bears will want a strong sell signal bar and a reversal down. The market often goes sideways at resistance for many bars before either rallying or reversing.
Possible double top
Patterns are rarely perfect. For example, when the Emini turned down 2 weeks ago, I called it a double top with the February high. I said that even though the June high was far below the February high. It was still a reversal down from a test of that high and therefore a double top.
This week went below last week’s low and therefore triggered the sell signal. However, the week closed in its middle and had a bull body. That is not how bear trends typically begin. When things are unclear, the market usually goes sideways. It has been sideways for 3 weeks. This week did nothing to change anyone’s opinion.
If the Emini resumes up and reverses down from around the February high again, that will be another double top. Perfect double tops are rare. The 2nd high is usually above or below the 1st high. It is often relatively far above or below. But if there is a 2nd reversal down from around a prior high, it is a double top.
Whether or not there is a new all-time high, traders expect some kind of double top. The February/March selloff was so strong that there should be at least a 2nd leg down back to the middle of the 2 1/2 year trading range before there is a break far above the February high.
Daily S&P500 Emini futures chart:
Bull flag makes higher prices likely
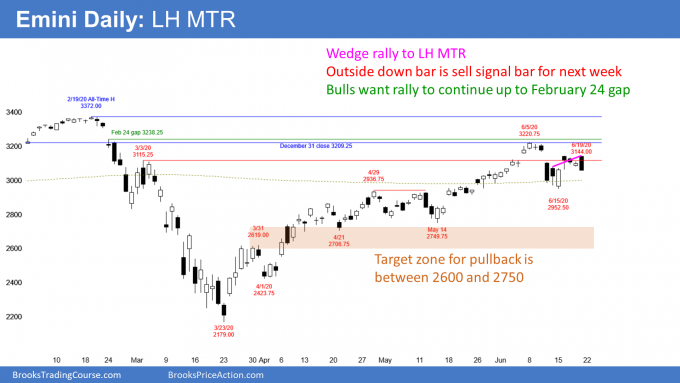
The daily S&P500 Emini futures chart this week reversed up from a 5 day selloff and then reversed back down. Every other selloff since the March crash low was 3 days or less. This is a longer and deeper selloff. That is a sign that the bull trend is weakening.
Also, 6 of the past 8 days had bear bodies. I talked about the supply in this area. Those bear bars mean traders are using bounces to sell.
However, it is still a bull trend and there are important targets above. The June rally turned down from just below the gap above the February 24 high. Since that gap was huge and it began the February/March crash, it is very important. Despite the big bear bars of the past 2 weeks, there is still a 50% chance that the rally will reach into that gap before correcting.
What about the February/March crash?
The Emini fell 35% in 2 months in February and March. That was the biggest selloff since the financial crisis in 2007 – 2009.
Also, it was extremely quick. A bear major surprise like that has a 70% chance of a 2nd leg sideways to down.
In 20% of the cases, the 2nd leg down does not begin until after there is a new high. There is currently a 50% chance that this rally will enter the gap above the February 24 high of 3,238.25.
Additionally, there is now a 40% chance that it will continue up to a new all-time high. If the Emini makes a new high, is there still a 70% chance of about a 50% retracement of the 3 month rally? No, but the math is still good for the bears. Unless the Emini breaks far above the February high, there would still be a 60% chance of a 50% retracement of the 3 month rally. That would be about a 15% correction.
Remember, a surprisingly strong move up or down has a 70% chance of a 2nd leg. The bears are still waiting for their 2nd leg sideways to down.
But the 3 month rally was surprisingly strongly up. Consequently, the bulls will buy the 2nd leg down, and that buying will create their 2nd leg up. The 15% down and then a 2nd leg up will probably take many months. Traders expect the Emini to continue its 2.5 year trading range for the remainder of the year.
Downside targets include breakout points and prior higher lows
Once the bears take control, how far down will the Emini fall? Traders will look for a pullback to a breakout point. For example, the April/May double top is 2,936.75.
Another breakout point is the March 31 high of 2,619.00. There was a pullback on April 21, but its low was far above the March 31 high. At this point, there is a 40% chance that the selloff will close that gap.
Traders also look at prior higher lows as support. The May 14 low around 2,750 was the start of a climactic 3 week rally. There is a 60% chance that a reversal down will get there. Traders expect a reversal to test the bottom of the most recent buy climax. That is the May 14 low.
Traders also look at percentage retracements
Next, traders think about percentages. Normally, they would be looking for a 10% pullback from the high. But the legs down and up were huge. Therefore, traders expect the pullback to be bigger than average. That is why I have been saying about 15%. Based on the current top of the rally, a 15% pullback is below 2,750.
A 10% pullback from the high is a correction. A 20% selloff is a bear market. Twenty percent down is 2,697. I have said several times that the Emini might get stuck between a 10% and 20% pullback for many months. That means it would test 2,700.
What about Fibonacci levels? Some institutions pay attention to them. There are so many to choose from that every one of them will be very close to the other targets I just mentioned. I therefore ignore them.
Will the Emini fall to a new low this year?
No, not after such a strong rally. There is only a 30% chance that the Emini will reach the March low before there is a strong break to a new high.
I know that 30% sounds pretty high, and it is. But the Emini has been in a trading range for 2.5 years. When a market is in a trading range, it is neutral. This is true even though it can have extremely strong legs up and down, like this one has had.
Neutral means that the bulls and bears are balanced. They alternate control. There are more sellers near the top and more buyers near the bottom.
The result is that the probability for just about anything will be between 40 and 60%. However, as long as it is in the trading range, there will always be at least a 30% chance of a new high and of a new low.
What will the Emini do next week?
The bears want a lower high major trend reversal down and then a 15% correction. Friday’s big outside down bar closing on its low gave them a 50% chance of succeeding.
However, don’t forget the 2 big bull days this week. The bulls are just as strong as the bears. There is therefore a 50% chance that the Emini will soon test above the February 24 high and into the gap on the daily and weekly charts.
The Emini is in the middle of a 3 week trading range. It could stay here for a couple more weeks before deciding on either continuing up to the gap or reversing down.
It probably will not stay sideways very long. We are entering a seasonal bullish window from around June 26 to July 5. That is the end of the quarter when there is often window dressing. Firms want to buy was has been doing well so that their quarterly report will show that they own the best stocks.
Also, there is usually some euphoria heading into the July 4th holiday. Finally, the Emini has been in a bull trend for 3 months. Unless the bears get follow-through selling next week, traders will expect a test of the February 24 gap.
Trading Room
Traders can see the end of the day bar-by-bar price action report by signing up for free at BrooksPriceAction.com. I talk about the detailed Emini price action real-time throughout the day in the BrooksPriceAction.com trading room. We offer a 2 day free trial.
Charts use Pacific Standard Time
When I mention time, it is USA Pacific Standard Time (the Emini day session opens at 6:30 am PST, and closes at 1:15 pm PST). You can read background information on the intraday market reports on the Market Update page.

