- Market Overview: Weekend Market Analysis
- 30-year Treasury Bond futures
- Bond futures weekly chart had weak follow-through after last week’s bear breakout
- EURUSD Forex market
- EURUSD weekly chart is reversing down from a nested wedge top
- S&P500 Emini futures
- Monthly Emini chart has only a doji bar in its breakout above top of nested bull channels
- Weekly S&P500 Emini futures chart has an ioi Breakout Mode pattern
- Daily S&P500 Emini futures chart is stalling at top of bull channel
Market Overview: Weekend Market Analysis
SP500 Emini January rally stalling at the top of bull channels on the daily and monthly charts. Also, there is an ioi Breakout Mode pattern on the weekly chart. Traders should expect a pullback to around 3500 to begin in January.
Bond futures broke below a 9-month trading range 2 weeks ago, but there was no follow-through selling this week. Traders will look to the coming week for a sign that the breakout will succeed or fail.
The EURUSD Forex market turned down this week from a wedge top. If there is follow-through selling this week, the selloff could continue down to the November 4 low at around 1.16.
30-year Treasury Bond futures
Bond futures weekly chart had weak follow-through after last week’s bear breakout
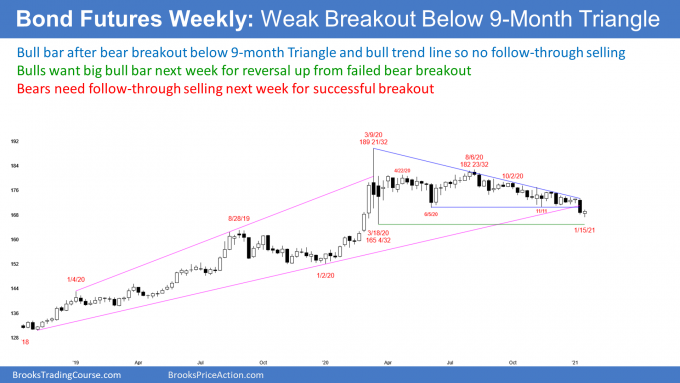
The weekly bond futures formed a big bear bar last week, and it closed far below the bottom of its 9-month trading range. This week was the follow-through bar, but it was disappointing for the bears.
If this week was a big bear bar closing on its low, traders would be expecting a quick selloff to the March low. But this week was a bull doji bar. That is a bad follow-through bar. However, its small body makes it a low probability buy setup after last week’s big bear breakout.
So if it is bad follow-through and a weak reversal setup, what should traders expect? Confusion typically results in sideways trading. Therefore, there is an increased chance of the bond market going sideways for a week or two. Traders wanted a clear sign that the breakout would succeed or fail. They did not get it. They now need more information, which means more bars.
Even though this week was a bull bar, its body was small compared to the body of last week’s bear breakout bar. Therefore, the chart is still slightly bearish.
But if next week forms a big bull bar, it will erase last week’s bear bar. Traders would then conclude that the breakout failed.
Alternatively, if next week is a big bear bar, traders will conclude that this week was just a pause in a bear trend. They will again expect a test of the March low and possibly the January 2, 2020 low.
EURUSD Forex market
EURUSD weekly chart is reversing down from a nested wedge top
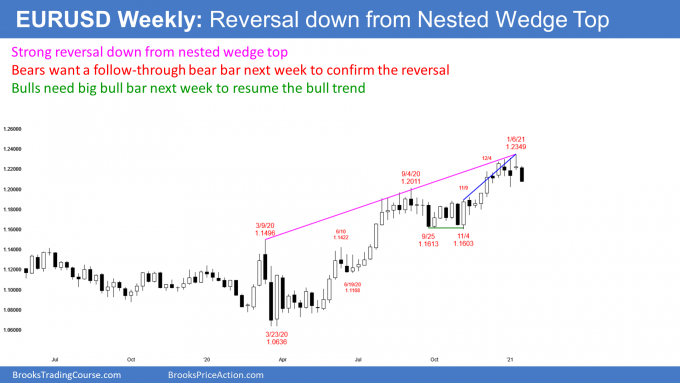
The EURUSD Forex market this week on the weekly chart, formed a big bear bar that closed near its low. This is the 2nd reversal down from a nested wedge top, and it is therefore a higher probability sell signal. The odds favor lower prices. The bears want a 2nd big bear bar next week to confirm the reversal. That would increase the chance of a trend reversal down.
When a wedge reverses, traders look for certain things. They expect at least a couple legs sideways to down. Also, the correction often has about half as many bars as the wedge rally.
The rally lasted 9 months. Will the selloff continue for 4 months? While it might, it probably will only be 2 or 3 months, assuming this is the start of a correction. Why? Because a reversal from a wedge top often stops at the bottom of the pullback after the 2nd leg up. That is the trading range from August through early November, and the low is around 1.16. It won’t take 4 months to get there, if this is the start of a correction.
What happens if next week forms a big bull bar, and totally reverses this week’s selloff? Traders would then think that the move up to 1.25 was still intact. But after a clear wedge top and a strong reversal down, more sideways to down trading is likely.
The 9-month bull channel on the weekly chart is a sign of strong bulls. But it is important to remember that the entire rally is just a leg up in a 6-year trading range on the monthly chart. I showed that last week. Therefore, traders should expect a pullback from a wedge rally to the top of that range.
Can the EURUSD reverse all the way down to below the 6 year range? It probably will not. If you look at that monthly chart, the entire selloff from the 2008 high looks more like a bull flag than a bear trend. This year’s reversal up was a double bottom. The odds are that the EURUSD will be sideways to up for at least another year. But, it is now likely starting to pull back for at least a couple months.
S&P500 Emini futures
Monthly Emini chart has only a doji bar in its breakout above top of nested bull channels
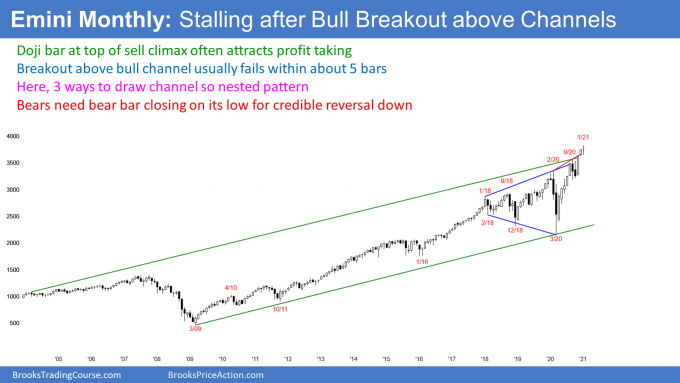
The candlestick on the monthly S&P500 Emini futures chart so far in January is a small bull doji bar, which is neutral. This follows 2 big bull bars, and it is a sign of a loss of momentum. Emini January rally stalling.
I have mentioned that the November/December strong rally follow a bad High 1 bull flag. September and October were bear bars, and they therefore created a weak buy setup. Additionally, the bad bull flag came late in a bull trend. That combination usually leads to a minor breakout. There is typically a 2nd reversal down after about a couple months.
The less bullish January is when the month closes, the more likely the Emini will begin to pull back in February. If January were to close on its low, it would be a strong sell signal bar for a reversal down from above a bad bull flag. That would probably result in a pullback for at least a month.
Alternatively, if January closes near its high, traders will expect at least slightly higher prices in February. The bigger the bull body in January, the stronger the bull trend.
What happens if January ends up with a small bull or bear body? It would reduce the chance of higher prices in February. However, it would be a weak sell signal bar. Traders would therefore expect February to be mostly sideways.
It is important to remember that the monthly chart is breaking above the top of nested bull channels. A breakout above a bull channel typically reverses down within about 5 bars. January is the 2nd bar. That reduces the chance of the Emini going much higher from here.
A nested pattern means there is one or more ways to draw the pattern. Here, there are 3 ways to draw the bull channel. A nested pattern has a higher probability of reversing.
Weekly S&P500 Emini futures chart has an ioi Breakout Mode pattern
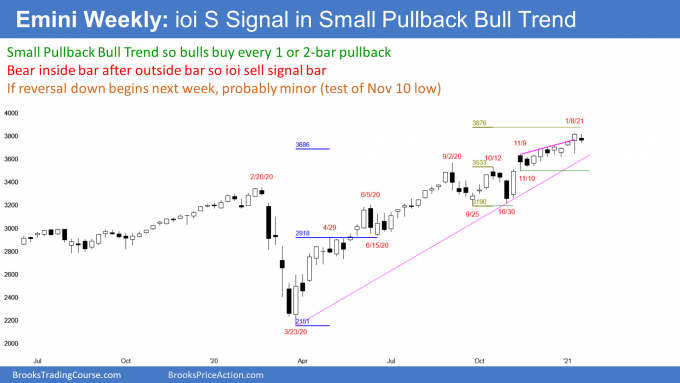
The weekly S&P500 Emini futures chart this week closed with a small bear body. Also, this week’s high was below last week’s high, and this week’s low was above last week’s low.
I wrote last week that there was an increased chance of an inside bar this week, after last week was a big outside up bar late in a bull trend. Well, this week ended inside. There is now an ioi (inside-outside-inside) pattern on the weekly chart. That is a Breakout Mode pattern. This week is therefore both a buy and sell signal bar for next week.
What happens if the buy signal triggers next week? Last week was an extreme buy climax bar, in a climactic rally from the October low. When there is trend resumption up after an extreme buy climax, it typically only lasts for a bar or two. There is then typically some profit taking, and at least a couple small legs sideways to down. Also, because this week had a bear body, it is a less reliable buy signal bar. There might be more sellers than buyers above its high.
But what if next week breaks below this week’s low? That would trigger the sell signal. Because the 9-week bull channel is tight, the reversal would probably be minor. An obvious target is the start of the channel, which is the November 10 low at around 3500. Traders should expect some profit taking soon. I have been saying that it would probably begin in January, but after January 6. That is still likely.
Daily S&P500 Emini futures chart is stalling at top of bull channel
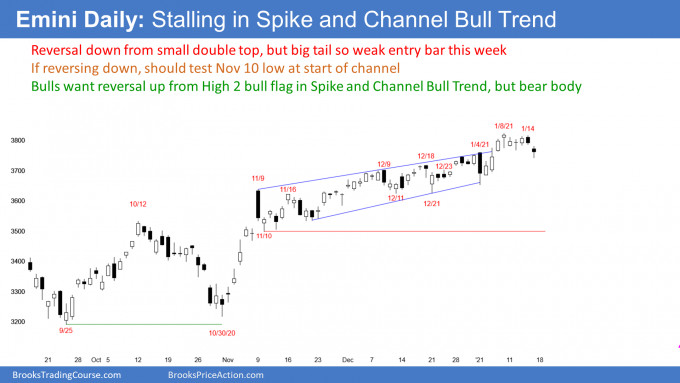
The daily S&P500 Emini futures chart has been in a bull channel since November 10. This followed a strong breakout in early November (a bull spike). A Spike and Channel bull trend typically evolves into a trading range. Traders expect a break below the bull trend line (the bottom of the channel), and then at least a couple legs down. The selloff usually tests down to near the start of the channel. That November 10 low is around 3500, which is therefore a magnet below.
But channels can go a long way before reversing. However, the Emini is now breaking above the top of the channel. A breakout above a bull channel usually reverses down within about 5 bars. This week’s sideways trading might be the start of the reversal down.
Friday was the first bear day that traded below a bear day, since the strong rally began on October 30. Is that a sign that a correction has begun? No, but it is something that increases the chance that a correction might begin soon.
It is important to note that Friday was not a big bear bar closing on its low. The tail on the low of the bar makes it less bearish.
You might notice that the close on the intraday chart is different from the close on the daily chart. On the 5-minute chart, the Emini closed at 3750.50 in the day session and 3746.25 in the Globex session on Friday. The CME uses an algorithm to calculate the close on the daily chart, and it can be very different from the close on the intraday chart. Today’s daily chart closed at 3762.25, which is 16 points above the close on the 5-minute chart on the CME’s website.
Until the bears get a couple consecutive big bear bars closing near their lows on the daily chart, traders will continue to buy every selloff. They know that most selloffs will be minor (bull flags), and that the bull trend will soon resume. While a reversal down to 3500 is likely to begin soon, there is no clear sign that the bull trend has ended.
There is one other noteworthy event this week. Friday collapsed, but reversed up strongly. It was simply a test of last year’s close. The market usually tests last year’s close at least a couple times.
It also occasionally tests other significant prices. For example, the 2020 pandemic crash was also just a test of the January 19, 2017 close. That was the price when President Trump took office. The selloff erased his entire bull trend, but the incredibly strong reversal up erased the entire selloff, and restored all of the gains and then some!
Trading Room
Traders can see the end of the day bar-by-bar price action report by signing up for free at BrooksPriceAction.com. I talk about the detailed Emini price action real-time throughout the day in the BrooksPriceAction.com trading room. We offer a 2 day free trial.
Charts use Pacific Standard Time
When I mention time, it is USA Pacific Standard Time (the Emini day session opens at 6:30 am PST, and closes at 1:15 pm PST). You can read background information on the intraday market reports on the Market Update page.


Since the 8/6/20 top, did the bonds sell off in a bear channel that now has three pushes down?
Yes. In some of the posts over the past few months, I referred to that initial selloff in August as a spike down in a developing Spike and Channel Bear Trend. The next couple weeks will be important. They will tell us if this is a wedge bottom or the early stages of a successful measured move down.
But even if the bulls get a rally back to the October 10 high at the start of the channel, I still think it is more likely bonds will be lower 5 and 10 years from now.