Monthly S&P500 Emini futures candlestick chart:
Emini forming blow-off top leading to giving back 2018 gains
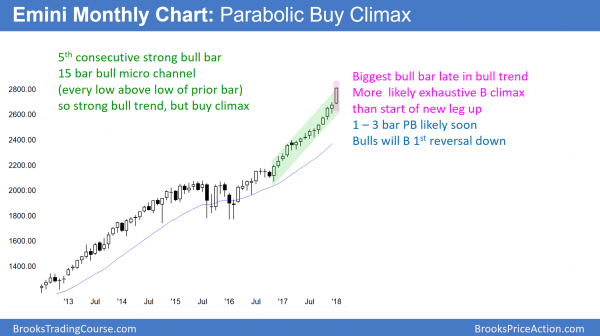
The monthly S&P500 Emini futures candlestick chart this month so far is a big bull trend bar in a parabolic wedge bull trend.
The monthly S&P500 Emini futures candlestick chart has not had a pullback since November 2016. This means the current rally is a 15 bar bull micro channel. That has never happened in the history of the S&P500 or the Dow Jones Industrial Index. It is therefore extreme, which means unsustainable and climactic. While this makes a pullback likely within the next few months, the micro channel represents extremely eager bulls. Consequently, the bulls will buy below the low of the prior month once they finally get an opportunity.
The result will be a brief pullback, lasting 1 – 3 months. Furthermore, the bars on the monthly chart are about 100 points tall. Therefore, when the market finally pulls back below the prior month’s low, the selloff will be 100 – 150 points below the high. Hence, it will be about a 5% correction.
Stock market in blow-off top
Since the micro channel is extreme and the rally is now accelerating up in a parabolic curve, it is a blow-off top. A top does not mean that the Emini will reverse into a bear trend. Instead, it means that the bulls are exhausted. Once they finally take profits, they might wait as long as 5 – 10 bars before they will buy again. While this is unlikely, traders have to be aware that extreme buy climaxes often lead to a long pause before the bulls buy again.
While a blow-off top sometimes leads to a bear trend, the odds are against it without the Emini entering a trading range 1st. Consequently, the downside risk over the next few months is probably 5 – 10%. The odds are that the bulls will buy the 1st selloff, resulting in a test of the prior high.
Weekly S&P500 Emini futures candlestick chart:
Weak follow-through buying
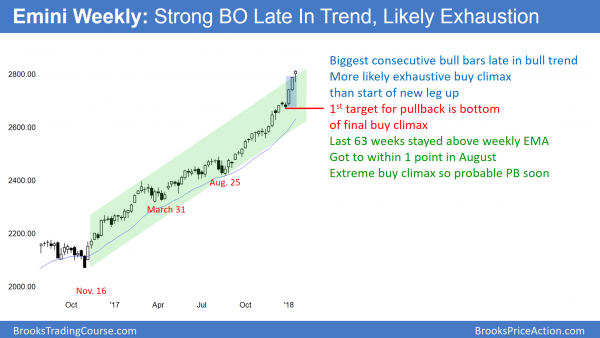
The weekly S&P500 Emini futures candlestick chart formed a doji bar this week after 2 big bull trend bars.
The weekly S&P500 Emini futures candlestick chart had 2 consecutive big bull trend bars over the 2 prior weeks. Since this is the biggest pair of bull bars late in a bull trend, it probably is an exhaustive buy climax. While there is often a small 2nd leg up after an exhaustion move, there is usually not much more than that before there is a TBTL Ten Bar, Two Legged pullback.
This means that the odds are that the Emini will begin to pull back within a few weeks. The 1st target is the bottom of the buy climax, which is the low of 3 weeks ago. It is also around the open of the year. Consequently, the pullback will probably erase all of the January rally. However, the weekly chart is so strongly bullish that the bulls will buy the pullback. As a result, it will likely lead to a rally back up to the all-time high.
An exhaustive buy climaxes usually leads to a pullback, not a bear trend
Can an exhaustive buy climax lead to a bear trend reversal? While it is possible, it is unlikely without the bull trend 1st transitioning into a trading range. That means that the bears will probably have to stop the rally for 2 – 3 months before they have a reasonable chance of taking control.
The pullback usually enters a tight trading range around the final buy climax low. That is the low of 3 weeks ago. The bulls will try to form a double bottom with that low. The bears want a breakout below that low and then a measured move down based on the height of the buy climax. If the bears get their reversal, the correction will be around 10%. The odds are against this, given how strongly bullish the weekly and monthly charts are.
20 week exponential moving average (EMA)
The weekly chart has not touched its 20 week EMA in 62 weeks. It is far enough above so that the bears will probably need several weeks of selling before the pullback reaches the average price.
This is the longest streak in the 95 history of the S&P500 index. While records are meant to be broken, they usually do not get broken by much. The current record of 62 weeks was in 1995, and the pullback began with the 57th week. While there is no top yet, the odds are against this rally continuing much longer before touching the 20 week EMA. The average is about 150 points below, but it is rising rapidly. Therefore a selloff of 100 – 120 points over three weeks would probably finally reach the average.
20 Gap Bar buy setup
For the pasts 62 weeks, there has been a gap between the low of every bar and the moving average. When 20 bars have gaps and the pullback finally reaches the moving average, this is a 20 Gap Bar buy setup.
The bulls have been so eager to buy that they have been willing to pay an above average price for more than a year. Consequently, they will probably be happy to buy at the average price once they get a chance.
When the price stays above its average for 50 or more bars, the bulls often wait for the pullback to stabilize at the EMA before they will buy again. They want to be sure that the climax will not lead to a 10 – 20% correction. They know that when the buy climax is unusually extreme, the pullback can be deeper and last longer than it typically does. Consequently, the selloff might have to fall 20 – 50 points below the average price before the bulls buy again.
Daily S&P500 Emini futures candlestick chart:
SUMMARY
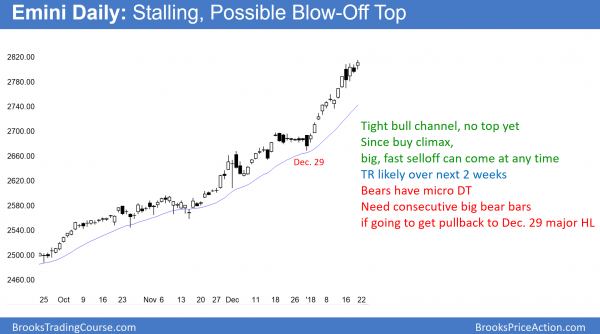
The daily S&P500 Emini futures candlestick chart has formed a 4 day tight trading range after an extreme rally.
The daily S&P500 Emini futures candlestick chart’s strong rally is losing momentum. However, there is no clear top yet. The bears have a micro double top, but no reversal down. They will need consecutive big bear bars before traders begin to believe that a correction has begun. Without that, the odds continue to favor at least slightly higher prices indefinitely.
The daily chart has not had a 3% correction in 444 calendar days and 299 trading days. This is by far the longest streak in history. While this can continue forever, it will not. It will probably end within the next few weeks. Furthermore, the correction will probably be at least 5% and not just 3%.
However, because the bull trend is so strong, the 1st selloff will probably be a minor reversal. This means that a bull flag or trading range is more likely than a bear trend. Since the weekly and monthly charts will probably fall 100 – 150 points, that would be a bear swing on the daily chart. Consequently, the selloff on the daily chart will probably be a bear leg in what will become a trading range instead of a bull flag. This is true even though the selloff will be a bull flag on the monthly chart and maybe the weekly chart as well.
Possible government shutdown
Congress will decide this weekend if they will fund the government. They can put the vote off again, pass the budget, or shut the government down. No one knows how the market will react. Everyone knows that shutting down the government will hurt consumer confidence. Therefore, it is bearish. What no one knows is whether that has already been fully discounted. If so, the Emini could even rally on Monday if there is a government shutdown. Traders simply have to wait to see what the market will do.
If it does rally, the rally will probably last only a week or two because of the 2 week exhaustion move on the weekly chart. If it sells off, the market will probably find support at the open of the year, which is the bottom of the 2 week exhaustion breakout.
Traders can see the end of the day bar-by-bar price action report by signing up for free at BrooksPriceAction.com. I talk about the detailed Emini price action real-time throughout the day in the BrooksPriceAction.com trading room. We offer a 2 day free trial.
When I mention time, it is USA Pacific Standard Time (the Emini day session opens at 6:30 am PST, and closes at 1:15 pm PST). You can read background information on the intraday market reports on the Intraday Market Update page.


Hi Al,
Why are you so bearish and use so much time on analysing the bear case? you have been wrong i all your predictions relating to the bear case(PB.)
Best Regards
Kent
I agree with you that the market is clearly telling me that a low probability event is underway. The low probability event is the lack of a pullback when the odds favor one. When a low probability event unfolds, it can last a long time. That is because low probability means big risk/reward. Big risk/reward usually means big reward.
Please read any of my weekend updates for the past 6 months. I have not been bearish at all. In fact, I have been very bullish. Every week I wrote that the odds favored higher prices, no matter how deep or fast the 1st pullback might be.
I have been looking for a pullback, which is a pause in a bull trend, and not a reversal into a bear trend. I have said every week that the trend up is so strong that the bulls would buy any pullback, even if it was big.
The reason I have been making the case for a selloff is that the weekly and monthly charts have never been this overbought in the 100 years of the stock market. Since markets are based on rational human behavior, patterns repeat. Furthermore, the market can rarely continue to do something that it has never done before. Consequently, the odds have favored a 5% pullback for 6 months. But, as I have said almost every week, climaxes can last much longer than what seems reasonable. This is the longest in 100 years. The odds still favor a 5% pullback soon. And, the odds are that the bulls will buy it.