Market Overview: Weekend Market Update
The Emini is in a strong bull trend. This will probably continue through the end of the year. But the rally has been climactic. That will probably attract profit takers within a couple weeks. If so, traders should expect a 50 – 100 point selloff and then a resumption of the bull trend.
The 30 year Treasury bond futures monthly chart is putting in a high that will probably last 20 years. But because the bull channel is tight, the current leg down will probably soon stall. The chart would then likely go sideways for a few months.
The EURUSD Forex market has been in a bear trend for 2 years. There has not been consecutive strong bull trend bars on the monthly chart at any point. However, the October rally on the weekly chart was strong enough to lead to a continuation the 3 month trading range for at least another month.
30 year Treasury bond futures market:
Rising interest rates for next 20 years
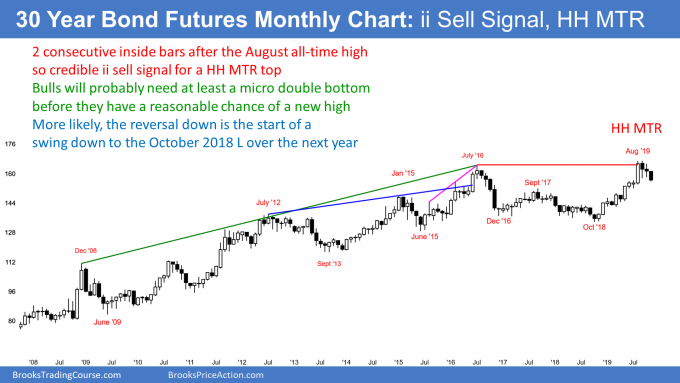
The 30 year Treasury bond futures market is continuing its collapse. A couple months ago, some pundits on TV were saying, “Gold to infinity, interest rates to zero.” At the time, I said that this was nonsense and that just because something sounds clever does not make it true. It holds the interest of the TV audience and sells commercials, but it misleads the public.
I have been saying for 5 years that the bond market was putting in a major top that will probably last 20 years. There were nested wedges on the monthly chart at the July 2016 high. Also, I said that because the top is on the monthly chart, it might take years to complete. The 2019 rally was a test of that high. It is probably part of the topping process. The 3 month reversal down is a higher high major trend reversal top.
This year broke above the 2016 nested wedge top. It is common for a wedge top to have a bull breakout and then a 2nd reversal down. When that happens, the probability is high that there will be a significant reversal down.
ii monthly sell signal triggered in November
There is an ii (inside-inside) sell signal bar setup that triggered this month. October was an inside bar and it was inside of September’s range, which was also inside bar. When November fell below the October low, it triggered the ii (consecutive inside bars) sell signal.
The bulls want November to close on its high. It would then be a High 1 bull flag buy signal bar for December.
However, the bears have a reliable top. If December goes above the November high, there will likely be more sellers than buyers up there. The best the bulls can probably get over the next several months is a trading range.
At the moment, there is a 60% chance that the August high will be the top for the next 20 years. But the parabolic wedge rally from the October 2018 low was in a tight bull channel. Therefore, there is a 40% chance that there will one more new high before the bear trend begins. That high, if it comes, will probably be brief.
What is the 1st target for the bears?
The 1st targets after a buy climax typically are the 20 bar EMA and the bottom of the final leg up in the buy climax. On the monthly chart, that is the big bull bar in August. Its low is 154 6/32. When the market gets there, it is usually also around the EMA as well.
Furthermore, traders should expect at least a couple legs sideways to down. Since this is a monthly chart, that would require at least several more months.
A tight bull channel does not suddenly reverse into a bear trend. Therefore the 3 month selloff will probably enter a trading range within a few months. That trading range could last 5 – 10 bars, which means a year. The bulls will see it as a bull flag. But since there is a reliable top, it more likely be the 1st pause in a new bear trend.
Interest rates cannot go to zero in the US
Can interest rates go to zero in the US, like so many pundits have been predicting? No, I do not believe so. This is because there already is a credible top in the bond market and therefore a bottom in interest rates.
More importantly, that is not how America works. Having zero interest rates is simply un-American. America sees itself as the leader of the world. Our heritage of capitalism is something that makes Americans particularly proud.
Most Americans would see zero interest rates as a sign of unacceptable failure on the part of our leaders. America borrows money (sells bonds) and the lenders (bond buyers) get nothing in return for helping us out? No, that is just too unfair and therefore un-American and too embarrassing.
Is America that cheap and selfish? Have we mismanaged our economy so badly that the world is now frightened of economic collapse? The politicians and the captains of industry know people are wondering about zero interest rates, and I cannot imagine them ever letting it happen.
EURUSD weekly Forex chart:
1 – 2 week pullback likely
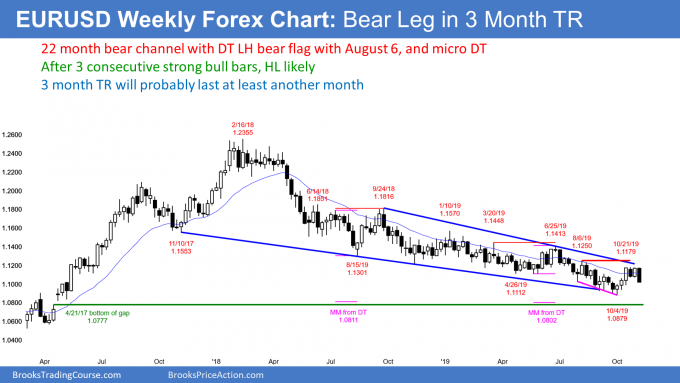
The EURUSD weekly Forex chart rallied for 3 weeks and then pulled back two weeks ago. The next week formed a bull bar closing on its high. That was High 1 bull flag buy signal bar.
This past week had to go above the high of that bull bar to trigger the weekly buy signal. It could not. Instead, it reversed down from within a fraction of a pip of the top of the bull bar. This is a sign of weak bulls and strong bears.
This week then traded below the low of the bull bar. There is now a micro double top on the weekly chart at the 20 week EMA in a 22 month bear trend. Furthermore, this week is now a sell signal bar for next week. The bears are hoping that the 2 year bear trend is resuming.
Only minor reversal and not bear trend resumption
The 3 week rally in October was the strongest leg up on the weekly chart since the bear trend began in February 2018. I have talked about this regularly in my daily updates. Traders should expect around a 50% retracement down from the 3 week rally. This selloff might test the September lows, which was support.
The bulls will probably soon buy again and that will start a 2nd leg sideways to up. Therefore the selloff will probably only last 2 – 3 weeks before the bulls return. But the best they probably will achieve is a continuation of the 3 month trading range for another month or so.
In my October 26 weekend update, I discussed the monthly chart. I made the point the bulls have been unable to create 2 consecutive strong bull bars at any point in the past 22 months. That makes that it difficult for the bulls this time as well.
However, if the bulls buy around a 50% pullback or a test of the September lows on the daily chart, that could lead to another month or two of sideways to up trading. That is what currently is the most likely result.
Monthly S&P500 Emini futures chart:
Gap above October high will probably close this month
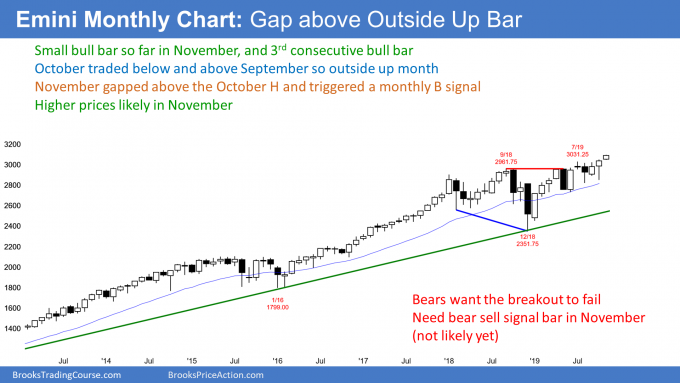
The monthly S&P500 Emini futures chart has a bull bar so far in November. Furthermore, November gapped above the October high.
Gaps rarely stay open on the monthly chart. Most close before the end of the month. Consequently, traders should expect a pullback to below the October high before the end of November.
But if the bulls can keep the gap open and get the month to close on its high, the rally might continue for 5 – 10 months before the gap closes.
Can the gap stay open forever? No. The monthly chart is in a buy climax and it is 10 years into a bull trend. Even if it rallies for several years from here, which is unlikely, the odds are high that there would be a pullback that closes the gap. Most likely, it will close in November. If not, then probably in the 1st half of next year.
Weekly S&P500 Emini futures chart:
2 week pullback should begin within a couple weeks
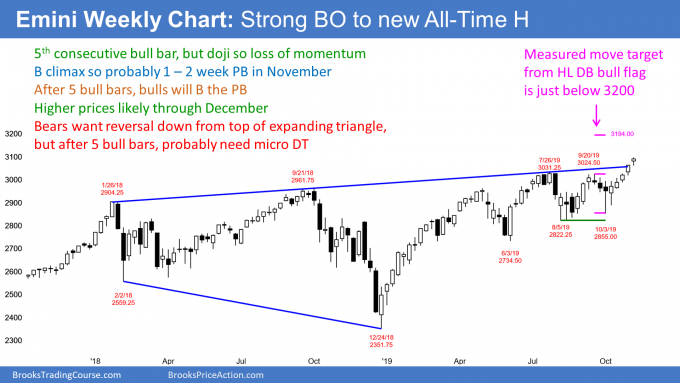
The weekly S&P500 Emini futures chart has rallied for 5 weeks. This is getting extreme. Many bulls will begin to take some profits within a week or two. That profit taking will create a 1 – 2 week pullback. A pullback means that the low of a bar is below the low of the prior bar.
This week was a doji bar. That is a sign of a loss of momentum and some profit taking. It increases the chance of a pullback beginning next week or the week after.
However, after a 6 bar bull micro channel, the bulls will buy that pullback. Traders should expect higher prices through the end of the year.
Daily S&P500 Emini futures chart:
Consecutive parabolic wedge tops so November pullback likely
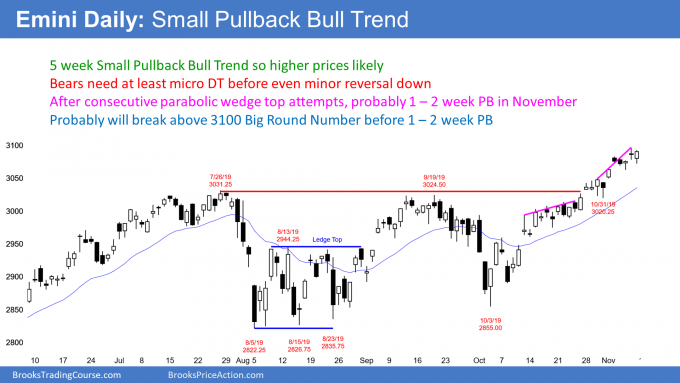
The daily S&P500 Emini futures chart is in a small pullback bull trend. Friday was a 1 day pullback and it closed near its high. It is a High 1 bull flag buy signal bar for Monday.
The 3100 Big Round Number is an obvious magnet and the bull trend is strong. Consequently, the Emini will probably break above 3100 early next week.
But it is important to see that there are now consecutive parabolic wedge tops over the past month. These are small and therefore minor buy climaxes, but they typically attract some profit-taking. Consecutive attempts at a top have a higher probability of leading to a pullback.
Also, many bulls are likely looking to take some profits above the resistance of 3100. Moreover, after a 5 week rally on the weekly chart, there will probably be a weekly pullback either next week or the week after.
Finally, the rally is similar to the rallies in late February, April, July, and September. Each led to sharp selloffs for a couple weeks. Yet, the bulls bought each selloff. Traders should expect something similar soon. However, it probably will be shorter and shallower than the June selloff.
Can the Small Pullback Bull Trend continue through the end of the year? Yes, but the consecutive parabolic wedge buy climaxes make a 1 – 2 week pullback likely first. While the odds favor higher prices, there will probably be a 50 – 100 point pullback at some point in November.
Minor reversal down to October high
Because the 5 week bull channel is tight, a reversal down should be minor. But a climax usually has at least a couple small legs down. That will require a week or two.
The selloff might retrace half of the October rally and close the gap above the October high. Another target is the October 31 low. That is the 1st pullback in the 2nd wedge rally. The start of a wedge is always a magnet in a reversal. Traders should expect a 50 – 100 point pullback to begin within a couple weeks.
As I said, traders should expect the selloff to be minor. That means a bull flag and not a bear trend. They should look to buy a reversal up after a week or two and expect a new all-time high. The resumption of the bull trend could last through the end of the year.
What about those Bear Surprise Bars on the 5 minute chart?
If you are a day trader, you have noticed about a half dozen unusually big bear bars on the 5 minute chart over the past month. For example, many bear breakouts have fallen 5 or more points in 1 second! The bar on the 5 minute chart ends up being about 10 points tall, which is very big compared to the prior bars.
Whenever a low probability event happens, it is a surprise. An unusually big bear or bull bar or series of bars is a Surprise Bar or Breakout. It traps traders into bad positions and out of good ones. That results in traders untrapping themselves on 1st pullback. That typically leads to at least a usually at least a small 2nd leg sideways to down.
None of the Bear Surprises had significant follow-through. This is because the bull trend is so strong on the daily and weekly charts. Traders see each sharp selloff as a brief discount and they eagerly buy.
Expect a Bear Surprise Bar on the daily chart this month
You may have noticed that over the past month there have also been many Bear Surprise Bars on the 60 minute chart. None had follow-through selling because the bulls were eager to buy the brief sale.
What might happen in the next 2 weeks is that this pattern could appear on the daily chart. There were several examples of big bear bars in late September.
A Bear Surprise Bar on the daily chart could create a 30 – 50 point selloff in a single day. After a bounce, there would likely be at least a small 2nd leg down. But like on the 5 and 60 minute charts, traders will see it as a brief sale and the bulls will buy it. Traders should expect a resumption of the bull trend after a week or two of selling. This is true even if the selling is surprisingly strong.
Trading Room
Traders can see the end of the day bar-by-bar price action report by signing up for free at BrooksPriceAction.com. I talk about the detailed Emini price action real-time throughout the day in the BrooksPriceAction.com trading room. We offer a 2 day free trial.
Charts use Pacific Standard Time
When I mention time, it is USA Pacific Standard Time (the Emini day session opens at 6:30 am PST, and closes at 1:15 pm PST). You can read background information on the intraday market reports on the Market Update page.


Next year the Social Security Trust Funds are expected to become net sellers rather than buyers of Treasury debt since the big bull market in bonds began. One more reason to be skeptical of much lower interest rates.