Market Overview: Weekend Market Analysis
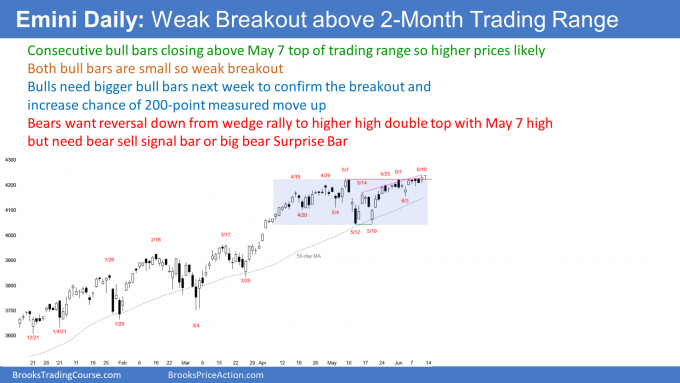
The SP500 Emini futures market had consecutive closes above the May 7 breakout point this week on the daily chart. Emini consecutive closes increase the chance of a successful breakout. The bulls will need bigger bull bars, and more bull bars if the breakout is to reach a 200-point measured move up from the 2-month trading range.
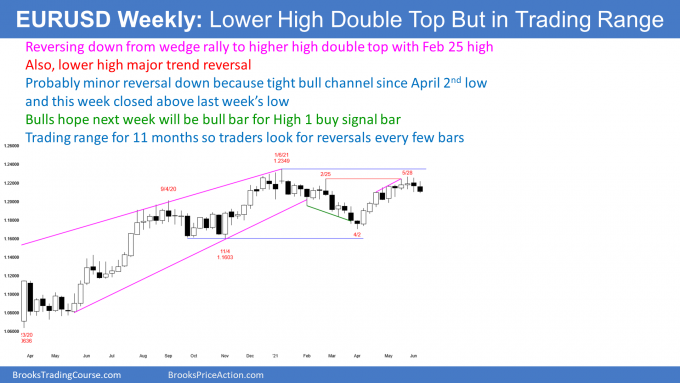
The EURUSD Forex weekly chart is turning down from a lower high double top with the January high. However, the reversal will probably only last a couple weeks before the EURUSD goes sideways again.
EURUSD Forex market
The EURUSD weekly chart

- Nested trading ranges. There is a 4-week tight trading range (200 pips tall) near the top of an 11-month trading range (700 pips tall). That range is near the top of a 7-year trading range (2,200 pips tall).
- Each of the 3 trading ranges is a Breakout Mode pattern. That means there is about a 50% chance of a bull or bear breakout, and a measured move up or down.
- As uniformly bullish as all of the TV experts are, there is no breakout until there is a clear breakout.
- Markets have inertia and resist change. Continued sideways is more likely than the start of a strong trend. Therefore this reversal down will probably only last a week or so, before the EURUSD goes sideways again.
- While the bulls might have a slight advantage, because of last year’s strong rally from a higher low (above the 2017 low), the EURUSD could not be going sideways if the bulls had a big advantage.
- It is almost as likely that the 200- or 700-pip breakout will be down, as it is that it will be up.
- To conclude that a breakout is likely to be successful, traders want consecutive closes above or below the range.
- The bigger the breakout bars, the more likely the breakout will succeed.
- The bulls want the 2-month rally to break strongly above the February 2018 high, which is the top of the 7-year range.
- The bears want a reversal down. This past week was a bear bar that closed near its low, so it might be the start of a reversal down. Traders expect at least slightly lower prices next week.
- This week closed just above last week’s low, and did not have a big bear body. It therefore is not yet a strong reversal down.
- If down, how far down? The 1st target is the bottom of the 10-month trading range at around 1.16, and the March 31 or November 4 lows.
- If the EURUSD were to break strongly below that, traders would then look for a test of the bottom of the 7-year trading range, which is last year’s low below 1.07.
- It is more likely that it will bounce for at least a couple weeks, if it falls to the bottom of the 11-month range this summer.
S&P500 Emini futures
The Weekly S&P500 Emini futures chart

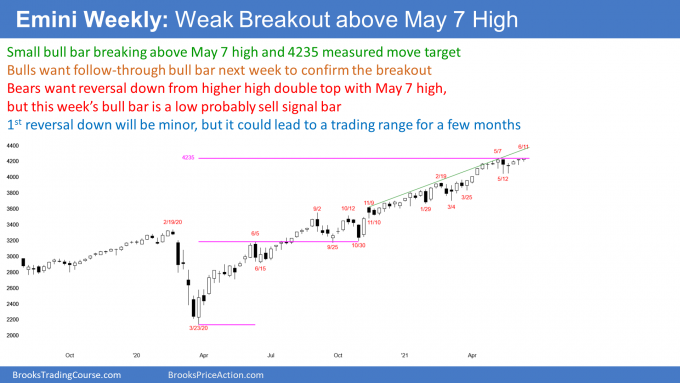
- Small breakout above the measured move target from the March 23, 2020 low to the June 5, 2020 high.
- This week broke above, and closed above the May 7 top of the 2-month trading range, but the breakout so far has been small.
- This rally has lasted more than 60 weeks, and a Small Pullback Bull Trend usually begins to evolve into a trading range after about 60 weeks.
- This increases the chance of a reversal within the next month or two.
- A Small Pullback Bull Trend ends with a big pullback. The pullback will be bigger, and last longer than any prior pullback in the trend.
- The biggest pullback was the September/October pullback, which fell 10%.
- Therefore, when the trend ends, the pullback should be more than 10%, and last longer than 2 months.
- While the Emini has been in a tight trading range for April and May, the pullback has only been about 4%. Therefore, the Small Pullback Bull Trend is still intact.
- Traders continue to expect higher prices, but know that a reversal down is likely to come soon.
The Daily S&P500 Emini futures chart

- Thursday was a bull bar that closed above the May 7 high. It was therefore a breakout above the range.
- Friday was the 2nd consecutive bull bar that closed above the May 7 high. Traders see it as confirmation of the breakout, and it increases the chance of higher prices.
- The breakout at this point is weak, because both bars were small, and barely closed above the May 7 breakout point. The bulls need bigger bars or several more small bars, to convince traders that the trading range is ending, and the yearlong bull trend is resuming.
- The bigger the bull bars, and the more they close on their highs, the more likely the rally will reach a 200-point measured move above the May 7 high.
- Friday was a bull inside bar in a bull trend. It is therefore a High 1 bull flag buy signal bar.
- The odds favor at least slightly higher prices, but unless there is a Bull Surprise breakout, the rally will probably not reach a 200-point measured move target.
- The rally is in a wedge bull channel. A reversal down would be from a wedge rally to a higher high double top with the May 7 high.
- That is a common reversal pattern, but the wedge is not clear, and there is no sell signal bar. The odds are against a major reversal without a good sell signal bar, or a big Bear Surprise Bar.
- A reversal would also be a higher high major trend reversal, and an expanding triangle top, which began with the April 16 or April 29 highs.
- Even a strong sell setup (this one is weak) in a bull trend, only has a 40% chance of leading to a trend reversal (into bear trend).
- Most of the time, a selloff from a top will be only a minor reversal. That means that it will be a pullback in the bull trend (bull flag), or lead to a trading range, just like every other reversal since March 2020.
- Until there is a strong reversal down, traders will continue to expect higher prices. They will bet that every reversal down will fail within a few bars.
- Once a correction is clearly underway, it is usually about half over.
- Traders will continue to expect higher prices until there is a strong reversal down.
Trading Room
Traders can see the end of the day bar-by-bar price action report by signing up for free at BrooksPriceAction.com. I talk about the detailed Emini price action real-time throughout the day in the BrooksPriceAction.com trading room. We offer a 2 day free trial.
Charts use Pacific Time
When I mention time, it is USA Pacific Time (the Emini day session opens at 6:30 am PT, and closes at 1:15 pm PT). You can read background information on the intraday market reports on the Market Update page.


Hi Al,
Since the 5/19 double bottom on the E-mini daily chart,
the market has been rallying in a tight bull channel.
Yet, we have had a lot of bear bars as part of that channel,
even though most of the time the market hasn’t traded below their lows.
Would you say the fact we have had so many bear bars in that channel, represent a strong selling pressure? Or is that selling pressure negated by the tightness of the bull channel and the fact that the market hasn’t traded below the lows of the bear bars?
I am trying to evaluate the buying and selling pressure of the current leg up.
When both sides both have something good, the market is balanced and in a trading range. Traders look to buy low, sell high, and take quick profits.
Here, the bull channel is tight, which makes higher prices likely after the 2-day breakout. Yet, the 2 bull breakout bars barely closed above the breakout point. That reduces the chance of a measured move up.
So, yes, higher prices, but not as high as the bulls want. The bull trend should end before the rally reaches a measured move based on the height of the 2-month range. As I said, the range should be more than 10% tall. It could easily be 20% tall, and it could last many months.