- Market Overview: Weekend Market Analysis
- 30 year Treasury Bond futures
- Bond futures weekly chart still in 7-month tight trading range
- EURUSD Forex market
- EURUSD weekly chart should have 2nd leg down from nested wedge top
- S&P500 Emini futures
- Monthly Emini chart has an ioi Breakout Mode pattern
- Weekly S&P500 Emini futures chart has weak sell signal for lower high double top
- Daily S&P500 Emini futures chart might get one more leg up before major reversal down
Market Overview: Weekend Market Analysis
The Emini has a micro double top sell signal on the daily chart. It might dip below the October 6 trading range high. Whether or not it reverses up to the September all-time high, the odds still favor a selloff from around that high.
Bond futures have been sideways for 7 months. There is no sign of a breakout. Traders keep looking for reversals every few days.
The EURUSD Forex has pulled back from a wedge top on the weekly chart. This week might be the start of a 2nd leg down. But the EURUSD market has reversed repeatedly for 2 months. Traders will continue to bet on reversals.
30 year Treasury Bond futures
Bond futures weekly chart still in 7-month tight trading range
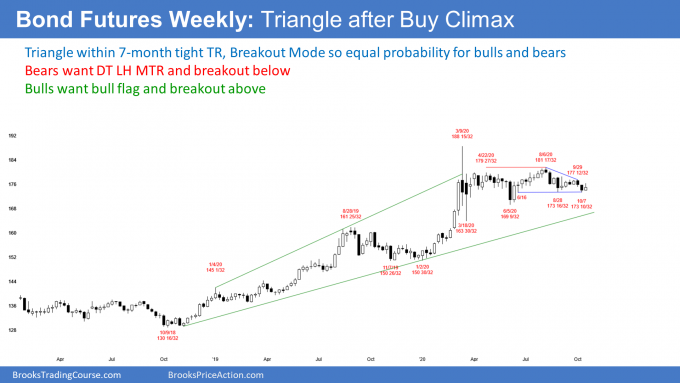
The weekly bond futures have been in a tight trading range for 7 months. Over the past 3 months, the trading range is also a triangle. Any trading range is a Breakout Mode pattern. That means there is about a 50% chance of a breakout in either direction. Also, there is a 50% chance that the 1st breakout will fail.
Everyone knows that the Fed said it will not raise rates for the next year. But they only control short-term rates. No one controls long-term rates. Since those rates will not fall to zero in the US, they can only go sideways to up. That means that the bond futures can only go sideways to down. But what is the path?
Why are the bonds not selling off?
If everyone know that, why aren’t bonds going down now? Markets are based on where traders think the price will go in the future. If rates cannot go down, they will eventually go up. Why isn’t the bond futures market selling off? Because of the time frame.
Yes, the bond market will probably be lower 5 to 10 years from now. It might even be significantly lower in a few months. But it can stay sideways for a long time before it starts to fall. Also, it could first even get back above the March high without interest rates reaching zero.
This uncertainty is what is preventing the selloff in bond prices. There are many fundamental concerns for bond investors that make them believe that rates could test the March low in rates, which means that the bond futures market can test the March high.
If there was a consensus about the fundamentals changing, the bond futures would break out of the 7-month range. But the only consensus at the moment is that the price is about right.
Traders can only make money based on price action
Investors and traders are different. Investors hold positions for months to years. For them, fundamentals are important.
As a trader, I am only interested in days to weeks. I cannot make money as a trader if I place trades based on my analysis of the fundamentals. They play out over months to years. The only way to trade profitably is by looking at the charts. They tell me what the institutions are currently doing and what is likely over the next few weeks.
For 7 months, the institutions have been buying low, selling high, and taking quick profits. That is the only way to trade bond futures right now. At some point, the futures will break out in either direction. Once they do, traders will be willing to hold onto positions for several weeks. Remember, though, they will trade lower for many years, but they might trade higher for several months first.
However, that is not today. Now, every time the bond market gets near the bottom of the range, like it did last week, traders buy for a 3 – 5 day bounce. They then take profits and look for the next trade.
EURUSD Forex market
EURUSD weekly chart should have 2nd leg down from nested wedge top
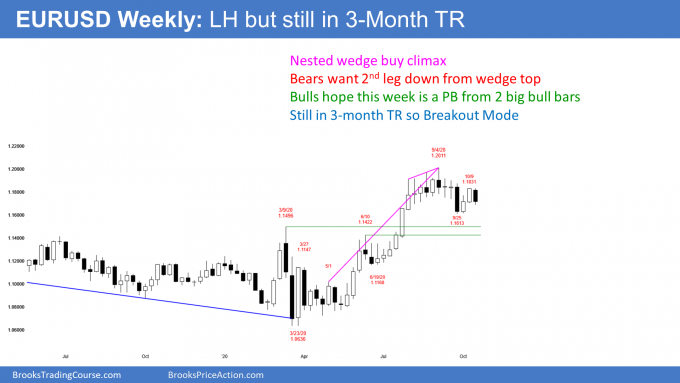
The EURUSD weekly chart sold off this week after a 2-week rally. The bulls want the rally to be a resumption of the 4-month bull trend.
The bears are hoping that the 2-week bounce was a pullback from the big reversal down 3 weeks ago. There was a 4-month rally with 3 pushes up this summer. That is a wedge, which is a type of buy climax. There was a smaller wedge nested in the 3rd leg up, which is a stronger sell setup. The bears see the 2-week bounce as a bear flag and expect lower prices.
But consecutive bull bars is a low probability sell setup. There might be many buyers below last week’s low. That reduces the chance of a big selloff next week. However, a 2nd leg down is likely soon.
The 4-month rally ended at the September 2018 high. There has been some profit-taking, but not much. After a buy climax, the bulls usually wait for 2 legs sideways to down before looking to buy again. That big bear bar 3 weeks ago was a 1st leg down. Since this week also sold off, it met the minimum objective of a 2nd leg, but sideways.
How long will the correction last?
Will the EURUSD continue down? It should. One other parameter that profit-takers consider before buying again is the duration of the selloff. They typically want it to last about half as long as the buy climax.
That rally lasted 4 months. This selloff has lasted only 4 weeks. Many traders believe that the EURUSD will probably continue sideways to down for at least a few more weeks.
Remember, the pullback from the wedge buy climax can be sideways, as it has been. It more often is down. Therefore, it is more likely that the selloff will not end until it falls at least a little below that September 25 low.
Another factor is that a strong bull breakout usually has a pullback down to the breakout point. That is the June 10 high of 1.1422, which is below the September low. Sometimes the pullback from a buy climax goes all the way to the bottom of the final leg up. That was the June 19 low of 1.1168.
Is the bull trend resuming?
What happens if next week is a bull bar closing near its high? Then traders will begin to believe that the correction from the wedge buy climax might be over. The bulls will start to buy again.
But it is important to realize that the weekly chart has been in a tight trading range for 3 months. Trading ranges resist breaking out. Even if the bulls get a 2 to 3-week rally, unless it breaks strongly above the September 1 high of 1.2011, it is more likely that the rally will be just a bull leg in the trading range. Traders will look for a reversal back down in the range.
S&P500 Emini futures
Monthly Emini chart has an ioi Breakout Mode pattern
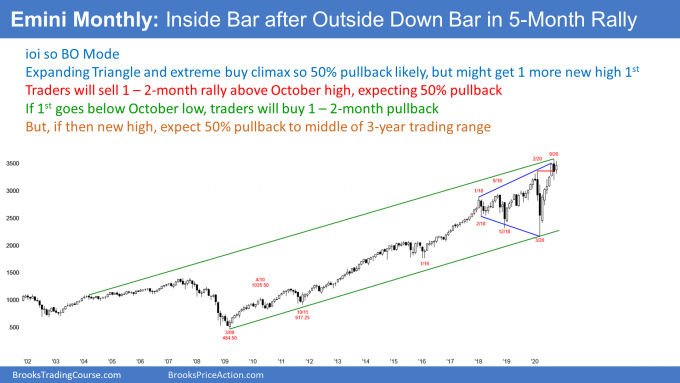
The monthly S&P500 Emini futures chart so far has a bull inside bar in October. This follows an outside down bar in September. This is an ioi (inside-outside-inside) Breakout Mode pattern. I talked about it last week. Nothing has changed on the monthly chart. There are 2 weeks remaining in October and the candlestick could look very different at the end of the month.
Weekly S&P500 Emini futures chart has weak sell signal for lower high double top
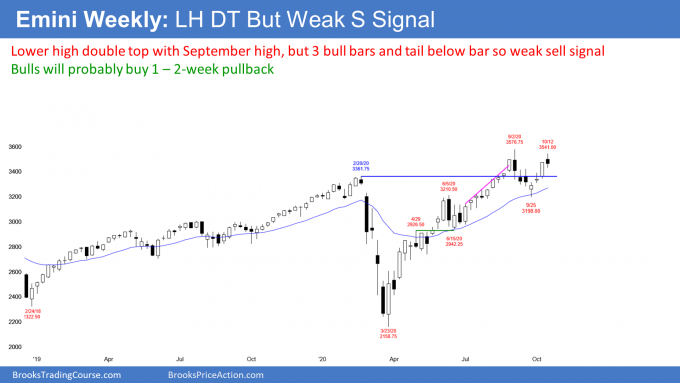
The weekly S&P500 Emini futures chart had a big bull bar last week and a small bear bar this week. Big bars tend to attract profit-takers, as you can see this week. Also, the Emini is just below the all-time high where it reversed down sharply in early September. Traders wondered if it would reverse down strongly again. The lack of follow-through buying this week surprised no one.
What about next week? The bears want the 4-week rally to be the 2nd leg up in a double top with the September 2 high. Sometimes the 2nd leg up in a double top is a very strong rally, like this one. But that is the exception. There is only a 30% chance that this week is the start of a reversal down from a double top that will lead to a bear trend. The bears will probably need a micro double top before they can get a reversal down.
Confusion is a sign of a trading range
If not a bear trend, then what? Whenever you look at a chart and you can see a good reason to buy and a good reason to sell, the chart is in a trading range. Since trading ranges resist breaking out, a continuation of the range is always the most likely possibility for the next bar or two.
The Emini might selloff for a week or two, but after a surprisingly strong 4-week rally, the bulls will buy the selloff. That should prevent this week from being the start of a collapse down to below the September 24 low. That is the neckline of the double top.
Trading range could last for months
The 3-month trading range could continue through the end of the year. But that is not likely. If the bulls get their break to a new all-time high, the 5-month buy climax will be even more extreme. That should limit the upside.
If the bears get a reversal down, the Emini could fall for a measured move based on the 400-point tall double top. That would be around 2800, which is approximately a 50% retracement of the 5-month rally. The bulls will probably buy that selloff, even if it lasts a couple months.
With limited upside and downside, the Emini will probably be mostly sideways for several more months. Traders are not yet sure exactly where the top and bottom of the range will be.
Daily S&P500 Emini futures chart might get one more leg up before major reversal down
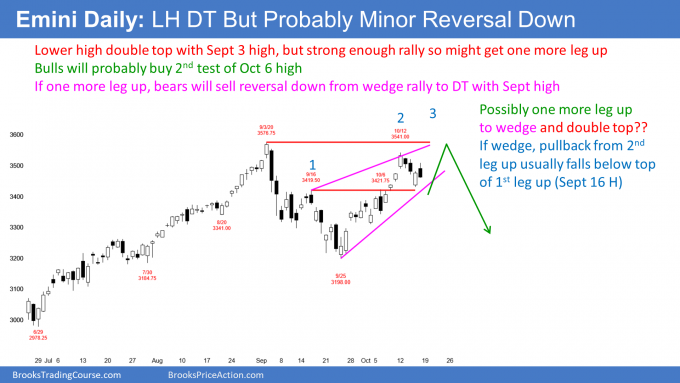
The daily S&P500 Emini futures chart has been rallying up from a 10% correction in September. If the Emini breaks above the October 12 high, but then reverses down, there would be a wedge rally to a double top. That is a common major reversal pattern. The 1st leg up in the wedge was the September 16 lower high. In this case, there was a new low after that 1st leg up.
When a market transitions from up to down or down to up, there is often a time when both trends coexist. The bulls and bears alternate control during the transition. That means the 1st leg of a bull trend can begin before the final leg of a bear trend. Also, the 1st leg of a bear trend often begins before the final leg of a bull trend ends.
Can the 4-week rally continue to far above the September high? There is currently a 30% chance that it could go up for a couple months to above 3700.
What happens if there is a rally over the next couple weeks and then a reversal down from a double top with the September 2 all-time high? As I said, a wedge rally to a double top is a reliable major reversal pattern.
If one forms and there is a good sell signal bar, the math would be good for the bears. They would have a 40% chance of a selloff to at least the September low. They would also have a 30% chance of a break below that low, and a measured move down to around 2800. Each new bar gives new information. These probabilities change with the new information.
What to expect next week?
The Emini broke strongly above the October 6 high, which was a double top with the September 16 high and the top of a 4-week trading range. The breakout had 3 consecutive bull bars closing near their highs. That is strong enough for traders to expect a 2nd leg sideways to up.
It is possible that Friday’s high was a 2nd sideways leg and the end of the rally. It is more likely that Friday’s sell signal will be minor. The 3-day selloff was surprisingly strong. Traders therefore expect a test of the bottom of the selloff. That was Thursday’s low.
Also, the Emini has been in a trading range for 3 months. When it is in a trading range, experienced traders expect disappointment. A common form of disappointment is that there is usually a pullback below a breakout point, even when the breakout is strong.
Additionally, if this is a wedge rally, which is likely, the pullback from the 2nd leg up usually dips below the top of the 1st leg up. That is the September 16 high, which is just below the October 6 breakout point. Therefore, the Emini will probably dip below the October 6 high next week.
Because the breakout was so strong, the bulls should buy around that support. They expect at 2nd leg up to above the top of the 1st leg up, which was this week’s high.
But if there is a 2nd leg up to above the 1st leg, it would be meeting the resistance of the September 2 all-time high. A reversal down at that point would be a double top. Also, the rally would be a wedge. As I said above, a wedge rally to a double top is a strong major trend reversal pattern. Therefore, there will be many traders looking to sell above this week’s high.
Trading Room
Traders can see the end of the day bar-by-bar price action report by signing up for free at BrooksPriceAction.com. I talk about the detailed Emini price action real-time throughout the day in the BrooksPriceAction.com trading room. We offer a 2 day free trial.
Charts use Pacific Standard Time
When I mention time, it is USA Pacific Standard Time (the Emini day session opens at 6:30 am PST, and closes at 1:15 pm PST). You can read background information on the intraday market reports on the Market Update page.


Really enjoyed this weekend report. Thank you Dr. Brooks.