Market Overview: S&P 500 Emini Futures
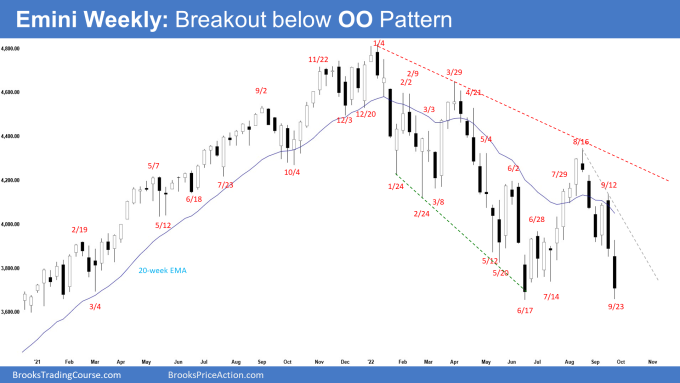
S&P 500 Emini futures breakout below OO pattern (outside-outside) and tested close to the June low. The June low is close enough to be a magnet. Bulls want a reversal higher from a double bottom major trend reversal. However, because of the strong sell-off, the bulls will need a strong reversal bar or at least a micro double bottom before they would be willing to buy aggressively.
S&P500 Emini futures
The Weekly S&P 500 Emini chart

- This week’s Emini candlestick was a big bear bar closing in the lower half of the range.
- Last week, we said that odds slightly favor sideways to down. Traders will be monitoring whether the bears get a consecutive bear bar or fail to do so.
- The bears got a strong consecutive bear bar this week and a breakout below OO pattern (outside-outside).
- The bears got a reversal lower from above the 20-week exponential moving average. They want a retest of the June low.
- They want a strong leg down like the one in April. The bears will need to create consecutive bear bars closing near their lows, to increase the odds of a retest of the June low. They got that this week.
- The selloff from August was in a tight bear channel. That means strong bears.
- The bears want a test of the June low, followed by a breakout and a measured move down to around 3450 based on the height of the 12-month trading range starting from May 2021.
- The move up from June 17 low was in a tight channel. The bulls want a second leg sideways to up after a pullback. At the very least, they want a retest of Aug 16 high.
- They want a reversal higher from a double bottom major trend reversal.
- However, they were not able to create follow-through buying following the bull outside bar 3 weeks ago.
- We said that the problem with the bull’s case was that the recent selloff was very strong. The second leg sideways to up may only lead to a lower high.
- The bulls hope that this is simply a re-test of the June low and want a reversal higher from a double bottom major trend reversal with the June low.
- However, because of the strong sell-off, the bulls will need a strong reversal bar or at least a micro double bottom before they would be willing to buy aggressively.
- Since this week was a big bear bar with a prominent tail below, it is a moderate sell signal bar for next week.
- This week was a breakout below OO pattern (outside-outside pattern).
- If next week closes as another consecutive bear bar, odds are the 3rd leg down of a larger wedge pattern is forming.
- For now, odds slightly favor sideways to down. The June low is close enough to be a magnet below.
- If the Emini trades higher, the bears want a reversal lower from a lower high around the bear trend line or the 20-week exponential moving average again.
The Daily S&P 500 Emini chart

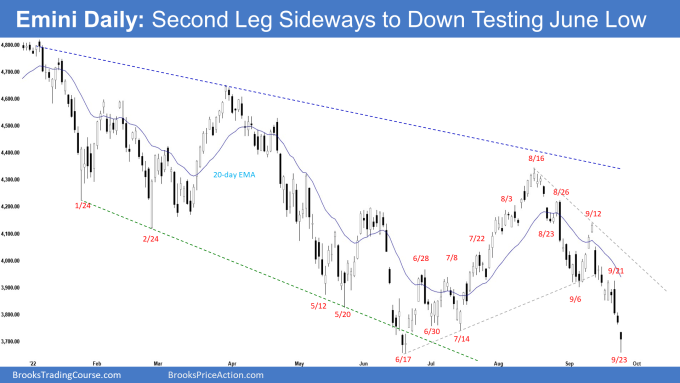
- The Emini traded sideways earlier in the week but reversed lower after the FOMC announcement and continued lower for the rest of the week. Friday gapped down but closed with a long tail below.
- Last week, we said that while the sell-off was strong enough for traders to expect at least slightly lower prices, traders should be prepared for some sideways to up pullback lasting days in between which can begin at any moment.
- The move up from June 17 low was in a tight channel. That increases the odds that the bulls will get at least a small second leg sideways to up, to retest August 16 high.
- So far, they have only managed to create a lower high.
- They see the strong selloff simply as a sell vacuum testing June low within a trading range.
- The bulls want a reversal higher from a double bottom with June low and a wedge bull flag (Aug 23, Sept 6 and Sept 23).
- The bulls will need to create consecutive bull bars closing near their highs to convince traders that a reversal higher soon to prevent a breakout and follow-through selling below the June low.
- The problem with the bull’s case is that the recent selloff from August 16 was very strong. The larger second leg sideways to up may only lead to a lower high which was the case.
- The bears want a retest of the June low, followed by a breakout, and a measured move down.
- The June low is close enough to be a magnet.
- If the Emini trades higher instead, the bears want a reversal lower from a double top bear flag with Sept 21 high, or around the bear trend line or the 20-day exponential moving average.
- Since Friday was a bear bar with a long tail below, it is a weak sell signal bar for Monday.
- While the selloff is strong enough for traders to expect at least slightly lower prices, traders should be prepared for some sideways to up pullback lasting days in between which can begin at any moment.
Trading room
Traders can see the end of the day bar-by-bar price action report by signing up for free at BrooksPriceAction.com. Al talks about the detailed Emini price action real-time throughout the day in the BrooksPriceAction.com trading room. We offer a 2 day free trial.
Market analysis reports archive
You can access all weekend reports on the Market Analysis page.


Dear Andrew, feel well and wish you a fast covid recovery. Bears got a MM nearly to the tick based on the 09/16 high with the 09/06 low. PA has sort of bounced there as this is also the area of the June low. In addition if you draw a parallel bear trend channel line with January & March high (February low), you will notice that Friday’s bounce was exactly there. So reasonable location for bears to take profit (June low , daily MM & bear trend channel line).
Dear Eli, thanks for the kind wishes..
And thanks for the added points too..
Be well!
Best Regards,
AA
When can we say that market is in a bear trend ? (or Broad Bear Channel). Because there’s always some kind of support. Now you said that’s evolving in a bigger wedge pattern, but reality is that every week market is going lower and what looked as a trading range is looking as a wedge that is failing. Sorry my question but is quite frustrating as bear trader. Thanks.
Hey Leonardo, good day to you..
I have always said the market has been in a broad bear channel up to now if you have been following my posts..
Yup, bigger wedge pattern = 3rd leg down = lower prices..
Maybe I did not write clearly, I apologize for that.. I’ve just got the covid so I’m keeping my reply short. Let me know if I have answered your question.
Best Regards,
Andrew
wish you recover soon thanks for reply
Thanks for your report Andrew!
To my interpretation last Friday was:
– an overshoot of the channel of the 8/16 and 9/12 trendline;
– a predictable sell-off race to the bottom (i.e. DB 16&17/6), as well as a measured move target (12/9 High to 15/9 Close, i.e. micro gap with 19/9 Close) for the bears;
– an almost exactly measured move from 9/22 High to the middle of the 9/23 Trading Range, to Yesterday’s Low (lower time frame).
Interesting also are the parallels to the last sell-off leg (June) and the current one, which both commenced around (ES12) 4130 (middle of the June TTR) and 12/9.
Prematurely, nevertheless, 3 bear bars with a close below the monthly 20EMA has not occured since 2008.
Relying on a traditional rally October, at least a decent minor reversal seems probable in my view. Time will tell ;-)!
All best,
Sybren
Dear Sybren,
I see a lot of points in your questions. Appreciate it.
Covid is frying up my brain, can’t process info too well at the moment.. I’ll come back to this post again when I feel better ya..
Be well..
Best Regards,
AA
Be well soon then, take care. See you next week!
Thanks Sybren!