Market Overview: Weekend Market Analysis
The SP500 Emini futures market is at the top of a 2-month trading range. A bull breakout is slightly more likely. The bears want a reversal down from a double top.
The EURUSD Forex is near the top of an 11-month trading range nested within a 7-year trading range. The odds slightly favor an eventual bull breakout. In the meantime, traders are looking for reversals every few days.
EURUSD Forex market
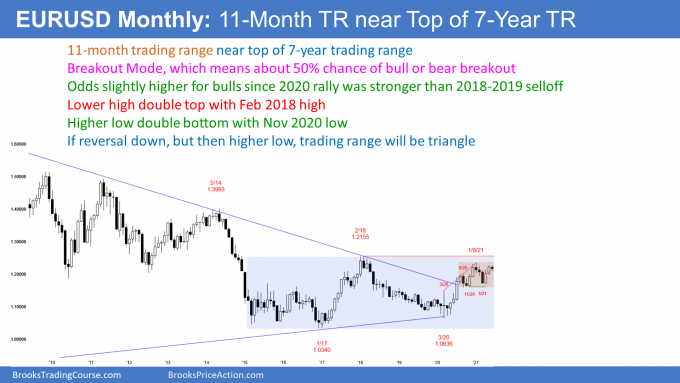
The EURUSD monthly chart

- 11-month trading range at top of 7-year trading range. Most attempts to break out of a trading range fail, adding more bars to the trading range.
- Trading ranges always have both reasonable buy and sell signals.
- They frequently contain both a double top and a double bottom. The pattern often evolves into a triangle before there is a breakout.
- June so far is bear inside bar. Bears are hoping it is the start of a selloff to the bottom of the 7-year range. More likely, it is not (see below).
11-month trading range
- Higher low double bottom (November 2020 and March 2021) and lower high double top (January and May, 2021).
- Bears want strong break below March low, which is neckline of January 2021/May 2021 double top.
- They then want measured move down from below the November 2020 low (bottom of 10-month range) to bottom of 7-year trading range
- Bears also want 2nd leg down from last year’s wedge top.
- Bulls want any selloff in June or July to be a pullback from the April/May strong rally.
- Bulls want the the November 2020/March 2021 double bottom to lead to a break above the February 2018 top of the trading range.
- The April/May rally was strong enough, so that the June selloff is more likely a pullback from that rally, than the start of a bear trend.
- Therefore, a selloff in June and July will probably stay above the March low, and the 10-month trading will have evolved into a triangle.
7-year trading range
- Higher low double bottom (January 2017 and March 2020), and a lower high double top (February 2018 and January 2021).
- If there is a big reversal down from here, it will probably not break below the 2017 bottom of the 7-year range, because last year’s rally was strong, and it came from a higher low.
- Furthermore, any selloff will probably turn up from above the March 2020 higher low.
- Therefore, if there is a big selloff from here, the trading range will more likely evolve into a triangle.
S&P500 Emini futures
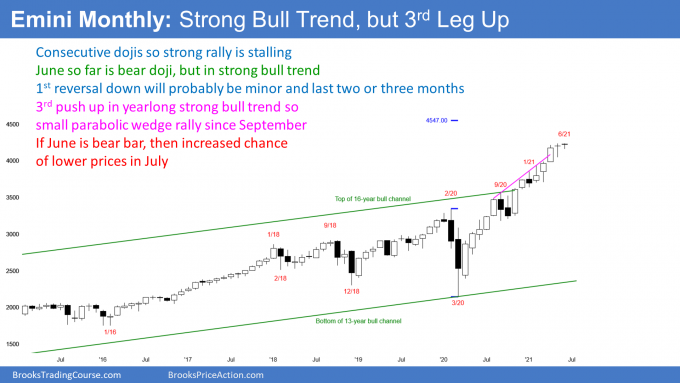
The Monthly Emini chart

- Strong rally from last year’s pandemic low, but rally has had 3 pushes up. It is therefore a parabolic wedge, which often attracts profit takers.
- Buy climaxes can last much longer than what seems reasonable.
- Parabolic wedge does not guarantee profit taking. The Small Pullback Bull Trend could continue for many more months, without a 2- to 3-month pullback, but that is unlikely.
- So far, June is a small bear inside bar.
- If it remains a bear bar, many traders will see that as a sign of profit taking in a parabolic wedge buy climax. That would increase the chance of lower prices for at least a couple months.
- Bulls want June to be a 5th consecutive bull bar. That would be unusual this late in a buy climax.
- Therefore, June will probably close below the open of the month, even if June goes above the May high before the end of the month.
- Because the bull trend is so strong, if the Emini sells off for a few months, the reversal will probably be minor.
- A minor reversal only has a 30% chance of growing into a bear trend (major reversal) without first transitioning into at least a small trading range.
- While the 1st pullback will probably be only a few months, it is important to note that it could lead to a trading range that could last a year or more. The January 2018 buy climax led to a trading range that lasted 2 years. The trading range that began in 2014 lasted more than a year, despite a very strong bull trend.
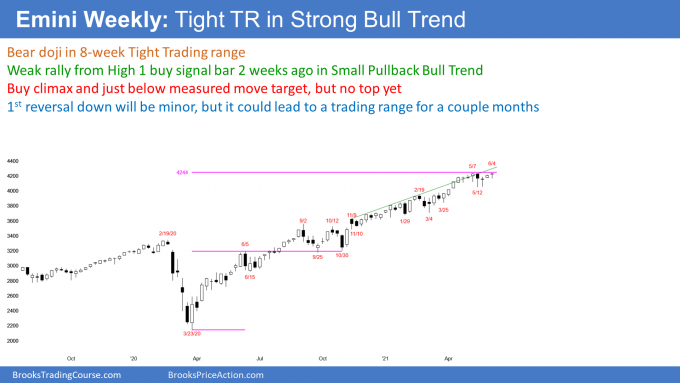
The Weekly S&P500 Emini futures chart

- Outside down week that reversed up, and ended as outside up week.
- Closed above last week’s high, but not above May 7 all-time high.
- Since closed just below all-time high, might gap up to new high next week.
- Bears want reversal down from small double top with May 7 high. Since strong bull trend, minor reversal is more likely than bear trend. A minor reversal is usually only a few weeks, like all of the other minor reversals since the March 2020 low.
- Small Pullback Bull Trend since March 2020.
- A Small Pullback Bull Trend typically evolves into a trading range once it has lasted 60 bars or so. Therefore, a trading range is likely soon.
- Weekly chart has been in a trading range for 8 weeks, but that is probably not enough to end the Small Pullback Bull Trend. Odds continue to favor higher prices.
- When a strong trend ends, it usually will have a correction that is deeper, and lasts longer than all of the prior corrections in the trend.
- This trend had a 10% correction that lasted 2 months (last September and October).
- Once there is a correction, it should be more than 10%, and last more than 2 months.
- If there is more than a 10% correction, traders begin to look for a 20% correction. This is because Institutions say that a correction has converted into a bear trend once it reaches 20%. Traders see it as a psychological support level, and therefore a magnet.
- Any reversal can be major (become a bear trend). The 1st reversal down in a Small Pullback Bull Trend only has 30% chance of growing into a bear trend without first evolving into a trading range.
- Therefore, even if there is a 20% correction that lasts several months, traders will expect a test of the high, before there would be a 40% chance of a bear trend.
- Until there is a clear, strong reversal down, the odds are that every selloff will just be another small pullback that will lead to a new high.
- A correction (10% or more) is typically not clearly underway until it is about half over.
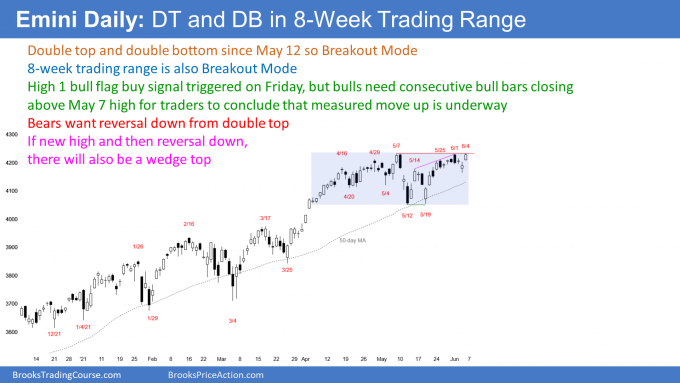
The Daily S&P500 Emini futures chart

- Friday triggered High 1 bull flag buy signal.
- Friday closed near its high, so might gap up to new all-time high next week.
- Even though trading range for 2 months, traders continue to expect higher prices. There is currently 60% chance of bull breakout, and 40% chance of bear breakout.
- Bears want reversal down from around May all-time high. Emini has stalled just above 4,200 for 2 months. It is therefore important resistance in an overbought market.
- If there is new high next week, and then a reversal down, there will be a wedge rally to a higher high double top. The 1st 2 legs of the wedge are the May 14 and June 1 highs.
- Wedge rally to a double top is a common topping pattern.
- Stock market tends to rally around June 26 through the 6th of July. That means it tends to not rally in mid-June, which increases the chance of sideways to down for a couple weeks.
- Most tops fail. Traders will continue to buy every reversal down until one is exceptionally strong. They will then conclude that the market is correcting.
- A correction is usually half over by the time traders decide it is underway.
- Once traders believe the market is in a correction, they like to wait for a 2nd leg down before buying again. That process could take several weeks and possible a few months. It can begin at any time.
Trading Room
Traders can see the end of the day bar-by-bar price action report by signing up for free at BrooksPriceAction.com. I talk about the detailed Emini price action real-time throughout the day in the BrooksPriceAction.com trading room. We offer a 2 day free trial.
Charts use Pacific Time
When I mention time, it is USA Pacific Time (the Emini day session opens at 6:30 am PT, and closes at 1:15 pm PT). You can read background information on the intraday market reports on the Market Update page.


The options market in the SPY tells me that it is hard to go for 2 times risk in the Emini or other derivatives of the cash index. If you look at SPY call or put spreads, it is generally difficult to structure spreads where the reward is twice the risk unless the strikes are so far apart that the chance of reaching the short strike is tiny.
That is a complicated paragraph, but the message is that most traders will look to take some profits at around 1 times risk in the Emini when trading the daily chart. The exception is when the market is trending strongly. Then, traders will try to hold as long as possible, which is often several times greater than their initial risk.
If a trader bought near the bottom of a trading range and the market is now near the top, he typically would be taking profits, regardless of the multiple of the initial risk. A trading range is a scalping market because most breakout attempts fail. The market is more likely to reverse than break out. Holding, hoping for a breakout, is not a good strategy.
A scalper needs high probability, which always means bad risk/reward. Therefore, when a scalper takes profits, he typically is not thinking in terms of a multiple of risk. He expects that most of his trades will be less than 2 times risk.
Hi Al,
I bought above the 5/19 bar on the daily E-mini chart for a swing up using a wide stop below the low of the 3/25 bar.
My profit target is 1x my initial risk, which is from above the 5/19 bar to below the 3/25 bar. Now, that the market has went my way, I can see what my actual risk is, which is just below the double bottom that formed with the 5/19 bar.
My question is, should I go for a profit target that is 1x initial risk, or 2x actual risk? The difference between my initial and actual risk is very large, since I am using a wide stop and I am not sure how the math will work on a basket of trades when having such a large difference between initial and actual risk. For example, if I have 5 winners based on profit that is 2x actual risk, would they compensate for 5 loosing trades when the wide stop based on the initial risk gets hit?