Market Overview: European Market Analysis
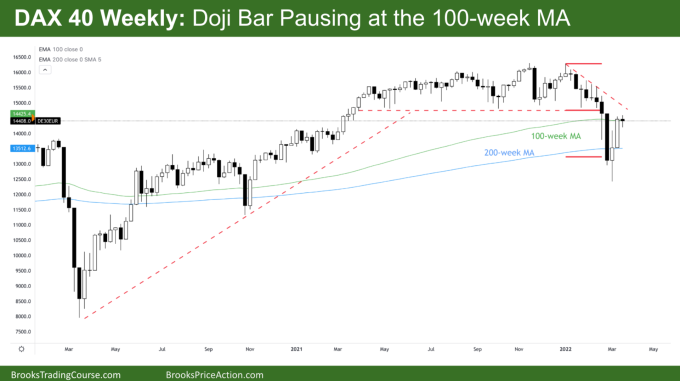
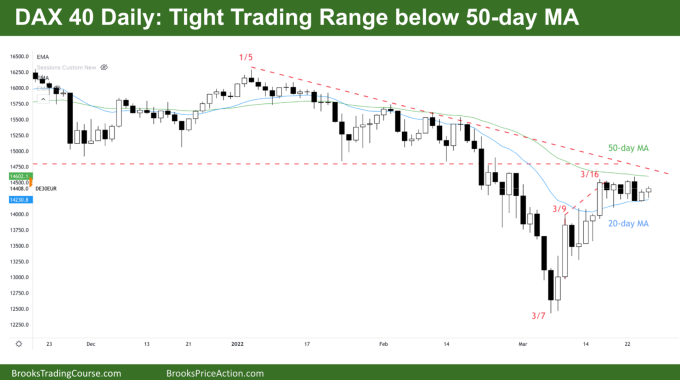
DAX futures paused last week just below the prior breakout point. Bears see the tight bear channel and are looking for reasons to sell the next move down. Bulls are looking a follow-through bar to prove the move down was simply a pullback in a much longer bull trend. On the daily chart it is a tight trading range, in another trading range, so it is breakout mode into next week.
DAX 40 Futures
The Weekly DAX chart

- This week’s DAX candlestick was a doji bar pausing at the 100-week MA, just below prior breakout point.
- It traded just above last week’s bar creating a high 1 buy signal, although it closed bearish. This might setup a failed buy signal into next week.
- The bears see a pullback from a tight bear channel lasting 8 bars so they expect the first pullback to be minor and are looking for a second leg down to the February lows.
- The bears also see a breakout of a 12-month trading range and now a pullback to test the breakout point at the base of that range.
- The bulls see a deep pullback on a 2-year bull trend up from the COVID lows. They know such a long trend is more likely to become a trading range and a reasonable buy rather than convert to a bear trend immediately.
- If we trade below next week we have a reasonable low 1 sell signal for a move down to the lows.
- Because we are at the prior breakout point of the trading range, the bulls will need a strong move to convince traders we are going higher. The best they might get is a bull leg in a trading range. They might keeping buying below.
- The bears know this and there will likely be sellers above.
- With sellers above and buyers below, it is likely we will go sideways next week while traders decide.
The Daily DAX chart

- Friday’s DAX candlestick was a small bull bar in the middle of a 9-day tight trading range.
- Wednesday was a failed low 2 sell signal that rejected the 20-day MA.
- The bulls see a final flag for a 3rd push up from a possible wedge from the March 7th low.
- The bears see a tight bear channel break of a trading range and the 2nd leg sideways to up before another reversal down.
- Tight trading ranges are breakout mode patterns and 80% of breakouts fail so we could see many tails next week as traders decide.
- If the bulls can break above the 50-week MA that might convince traders we failed to breakout of the range above and look to test the highs again. The best they might get is a bull leg in a trading range.
- If the bears can get a reasonable low 2, or at least a pair of consecutive bear bars that might convince traders we have started the 2nd leg back down to March lows.
- It’s not a reasonable buy or sell signal for beginners and most traders should wait until there is follow-through next week to avoid getting caught in failed breakouts.
- Because it is a tight trading range, in a larger trading range, traders will BLSH (Buy low sell high and scalp) and take quick profits.
Market analysis reports archive
You can access all reports on the Market Analysis page.


Thank you! Great to see analysis on other markets!