Market Overview: DAX 40 Futures
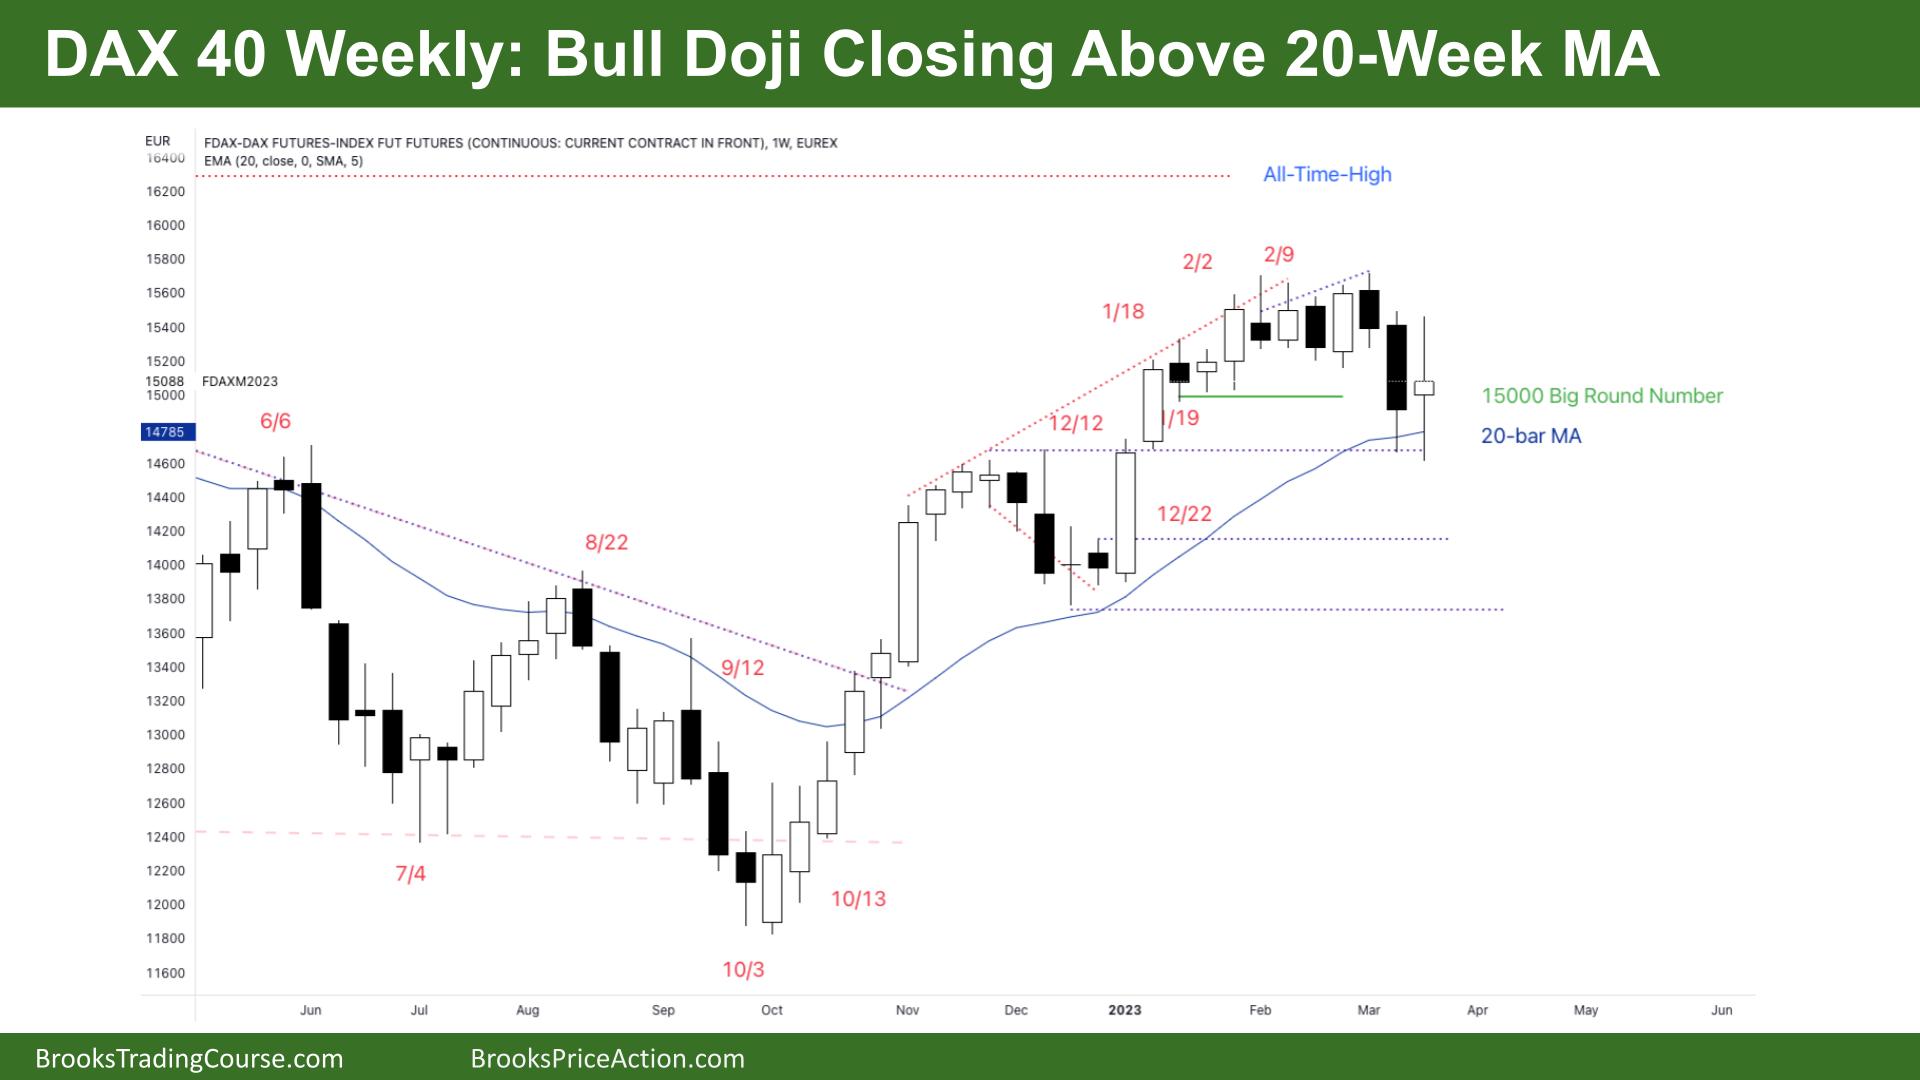
DAX futures moved sideways last week with a bull doji closing above the 20-Week MA. The bears have been unable to get follow-through for many months and have been scalping out at the MA. This leg has the best chance of a small leg sideways to down. But the best the bears can get here is probably a trading range. Bulls will buy the first week into the MA and below. But you can see the hesitation from the bulls buying above 15000 Big Round Number. It was nearly an outside bar so probably sellers not far above and buyers below.
DAX 40 Futures
The Weekly DAX chart

- The DAX 40 futures was a bull doji last week, closing above the 20-Week MA.
- The prior week was a sell climax, and some traders saw it as a second entry short, a Low 2 after several weeks of sideways trading.
- The bulls see a tight channel above the MA, and the bears have failed to get two reasonable legs in the pullbacks.
- The bulls also see a breakout of December and a test for a possible High 2 trend resumption.
- All traders expected buyers at the MA, and now two weeks have closed above.
- But the bears see that the prior week was surprisingly large and might need some more sideways.
- Last week we went right up to where the bulls had entered. They were expecting the tight trading range to continue and they got out. That might mean another leg down.
- It is a bull doji with big tails, so it is neither a great buy nor sell signal, so probably more sideways to down trading next week.
- Bulls might need a deeper pullback to buy again after such a strong rally.
- Bears might sell above bars with limits, but most bears should wait for a good stop entry sell signal. The MA is not typically a strong location for an opposite trade.
- There is a bad buy signal from December before the bull breakout. I think we will come back to visit. We are trending within a broader trading range – so we should expect all gaps to close and BO points to get tested.
The Daily DAX chart

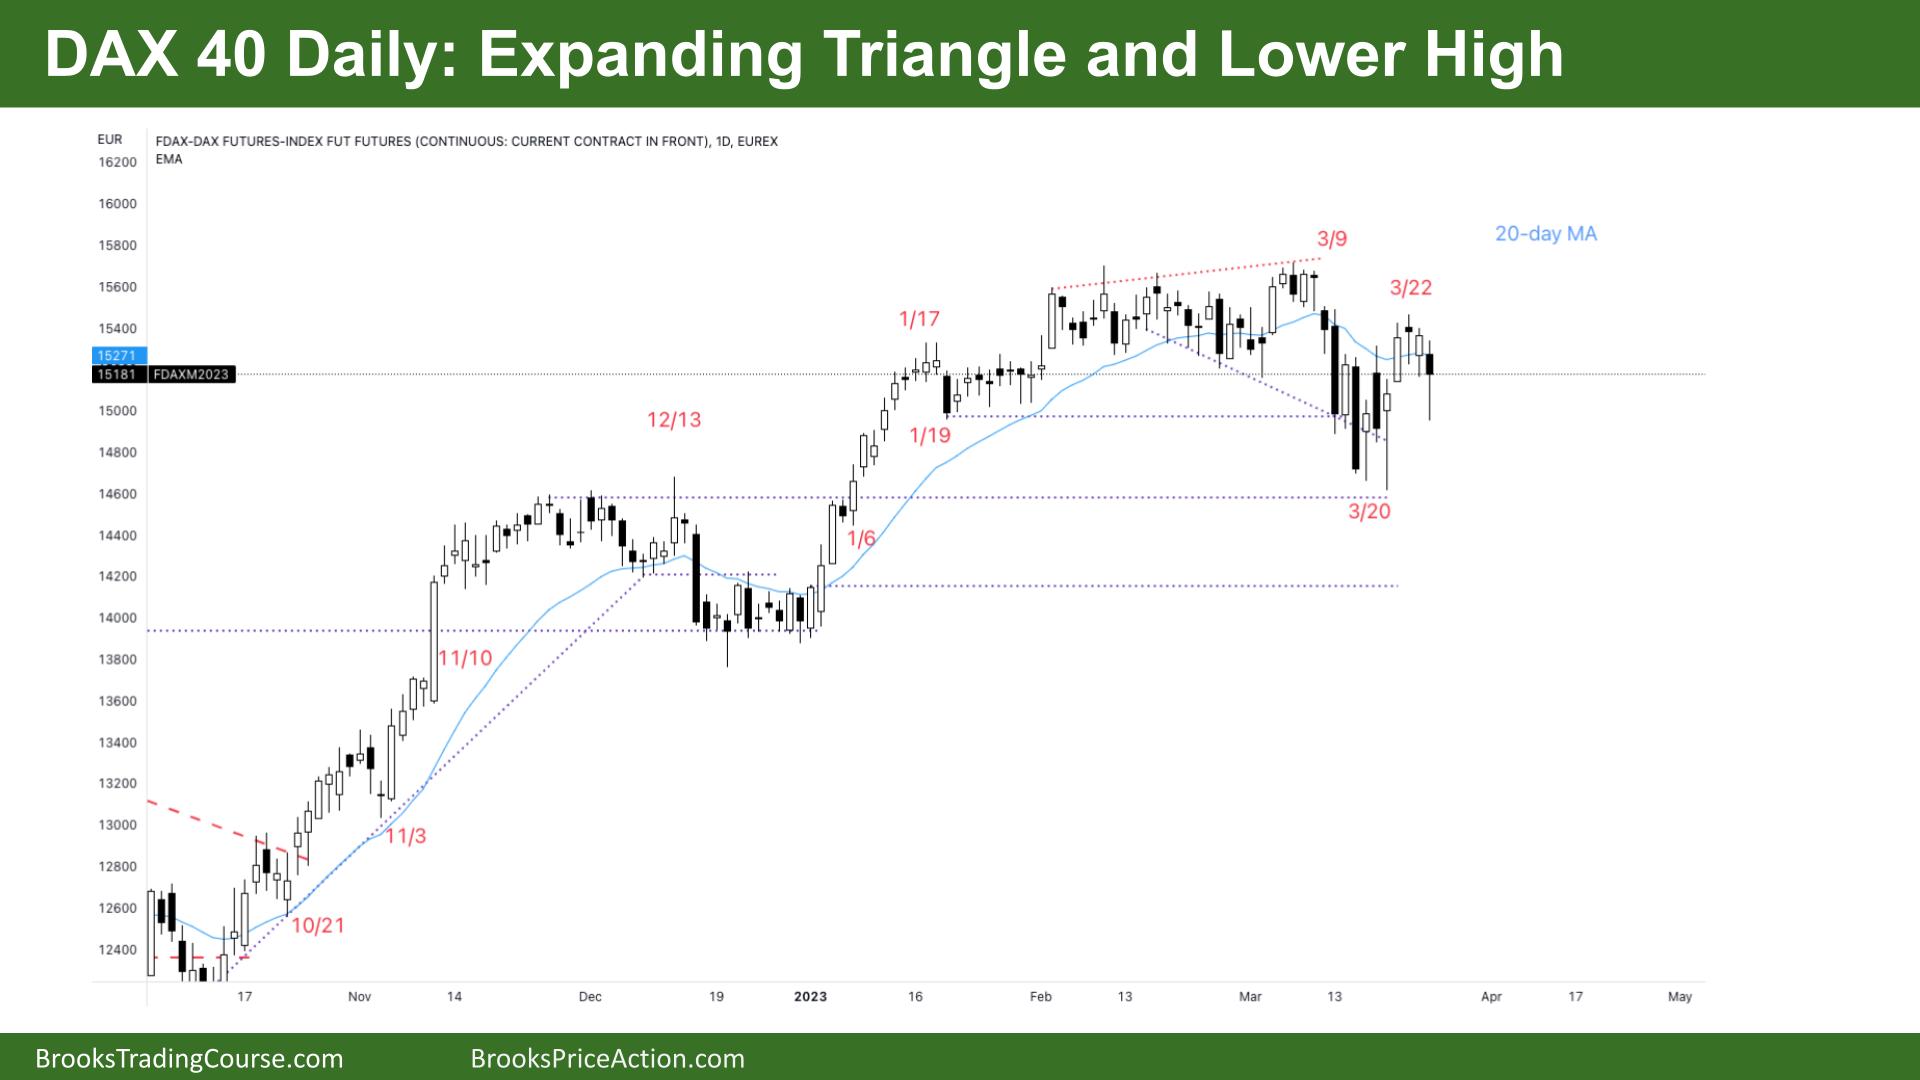
- The DAX 40 futures was a bear doji on Friday in a possible expanding triangle after a few weeks of sideways price action.
- It is confusing so a trading range on the lower time frames – most traders should BLSHS. But after such a strong bull channel on the weekly, there are probably buyers below.
- The bulls see a 50% pullback of the last week from the BO point and swing low.
- The bulls want another opportunity to buy, but it looks like they will buy lower after a deeper second leg from the bears.
- The tight trading range from December looks like a reasonable target for bulls to reload. But they might not get a chance to buy there.
- You can see the follow-through buying on Monday and Tuesday, so likely sideways next week.
- Can bears swing short from here?
- Most expected better follow-through in the prior week – so they are probably sitting above. The bears see climactic bear bars – perhaps a parabolic wedge bottom.
- But good for the bears to control the whole day, for several days in the past few weeks.
- Those big sell climaxes make it more difficult for the bulls to buy above – they would need a swing target to justify the risk.
- This will encourage traders to keep scalping.
- It’s a bear doji on the daily and a bull doji on the weekly, so it’s a bad buy signal, and it closed in the top half, so some computers see it as a bull bar – confusing. Probably buyers below and sellers not far above.
Market analysis reports archive
You can access all weekend reports on the Market Analysis page.


I just analysed the DAX for hours as I see several patterns repeating. I think the only clean pattern here would be to go up with accumulation to around 15080 (2nd leg up + to DT) beginning at Sunday night globex session and probably go down to 14850 during London session (+ due to 2nd leg down on 1h chart + I cannot imagine that the little bull bars can reverse the 3 big bear bars on the 1h chart), so I think it needs a micro DB on the daily chart to go more up. I AM A BEGINNER! I would be glad about feedback.